

What is this image?
(Image courtesy of J. Bechtold (Univ. of Arizona) and J. Scott.)
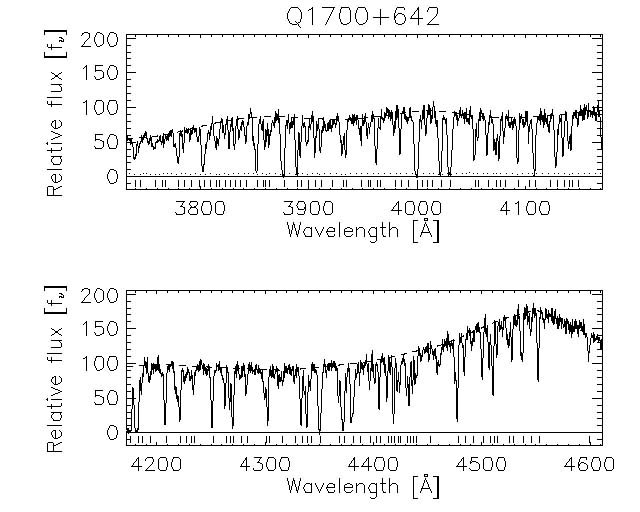
This is a Lyman alpha forest spectrum of quasar Q1700 +642 (see "Becoming a Scientist" section for more on "Lyman alpha forest"). The spectrum begins in the top panel and continues down to the bottom panel.
We get this kind of spectrum by placing a prism-like object, called a grating, between an instrument's detector and telescope. Light coming into the telescope is separated into its components by the grating before it hits the detector. This arrangement gives us measurements to produce graphs, like this one, of brightness (flux) vs. wavelength.
What exactly causes the bumps in the spectrum? We need some background information here. If a hydrogen atom is in its rest (ground) state, and it encounters a photon of light with just the right energy, the atom will absorb that photon and its electron will move to a higher energy (excited) state. This event results in a spectral absorption line. (If an atom starts off in an excited state, the electron may drop to a lower energy state and emit a photon of that same energy. This creates a spectral emission line.). Clouds of hydrogen gas in the vast space between galaxies cause such absorption lines in the spectra of astronomical objects that are, from our viewpoint, behind them.
The universe is expanding. We know this because the further away an object is, the more its light is shifted toward the red end of the electromagnetic spectrum (lower frequency, longer wavelength). This is the Doppler shift, familiar from the police siren you hear increase in pitch as it approaches you (higher frequency), and decrease in pitch as it moves away (lower frequency). Shorter wavelengths correspond to bluer light; the longer the wavelength, the "redder" the light.
The rest wavelength of a Lyman alpha line would be 1215 angstroms. The quasar is the most distant object represented here, so it's the most highly redshifted. Its Lyman alpha emission line is the broad hump in the graph that ranges from around 4450 to 4600 angstroms. Because hydrogen clouds lie at different distances along the line of sight to the quasar, their absorption lines are redshifted by different amounts - the further away the cloud, the greater the redshift in the absorption lines it causes. Lines shifted by this much means this quasar is 20 billion light years away!