What's the Frequency, Roy G. Biv?

What's the Frequency, Roy G. Biv?
Suggested grade levels: 6-9
Estimated class time: 2-3 class periods
Lesson plan by Kara C. Granger of Maria Carillo High School in Santa Rosa, CA
Summary
This lesson is based on the concepts of frequency and wavelength, how they relate to each other, and how they correlate with the colors of the visible spectrum. The students will examine these concepts through a hands-on lab that involves measuring and timing "wavelengths" by pulling adding machine tape through a simple, student-made apparatus. This lab is also followed up with critical thinking and performance assessment style questions.
Objective
- Students will discover and verify the relationship between Wavelength and Frequency of the Electromagnetic Spectrum.
National Education Standards
National Science Education Standards
This lesson plan addresses the following National Science Education Standards:
NS.5-8.1 Science as Inquiry
As a result of activities in grades 5-8, all students should develop:
- Abilities necessary to do scientific inquiry
- Understandings about scientific inquiry
National Council of Teachers of Mathematics
This lesson plan addresses the following educational standards from the National Council of Teachers of Mathematics:
- Process Standards
- Problem Solving
Instructional programs from prekindergarten through grade 12 should enable all students to:- build new mathematical knowledge through problem solving
- solve problems that arise in mathematics and in other contexts
- Connections
Instructional programs from prekindergarten through grade 12 should enable all students to:- recognize and use connections among mathematical ideas
- Problem Solving
- Algebra
- Understand patterns, relations, and functions
In grades 6-8 all students should- represent, analyze, and generalize a variety of patterns with tables, graphs, words, and, when possible, symbolic rules
- relate and compare different forms of representation for a relationship
- Use mathematical models to represent and
understand quantitative relationships
In grades 6-8 all students should- model and solve contextualized problems using various representations, such as graphs, tables, and equations
- Understand patterns, relations, and functions
- Data Analysis and Probability
- Select and use appropriate statistical methods to
analyze data
In grades 6-8 all students should- find, use, and interpret measures of center and spread, including mean and interquartile range
- Develop and evaluate inferences and predictions
that are based on data
In grades 6-8 all students should- use observations about differences between two or more samples to make conjectures about the populations from which the samples were taken
- Select and use appropriate statistical methods to
analyze data
Prerequisites
- Math: Students should have had some Pre-Algebra, especially in the areas of manipulation of formulas and pattern recognition.
- Science: Students should have had an introduction to the electromagnetic spectrum and the concepts of wavelength and frequency.
Materials
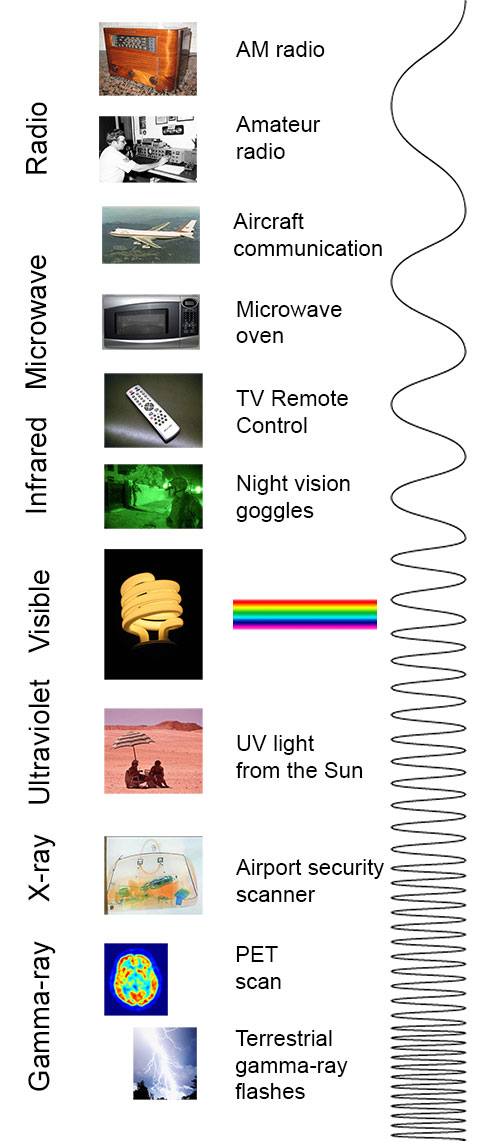
Graphic depicting the electromagnetic spectrum. (Click image for a larger version.)
- Teacher
- roll of adding machine tape
- For each triad of students
Introduction
Show students the graphic on the electromagnetic spectrum shown to the right. Have them write for five minutes in their journals about the graphic. Tell them to think about the relationships in and among the various wavelengths and the position of each type of radiation in the electromagnetic spectrum.
Background
Explain to your students that the visible light from the Sun is actually composed of the colors red, orange, yellow, green, blue, indigo, and violet, which can become distinguishable when sunlight passes through a prism. A good way to remember the order of the colors is to note that the first letters of the colors spell out the name ROY G. BIV. We can think of light traveling in waves with properties of wavelength and frequency. Wavelength is the distance between identical locations on adjacent waves. The illustration below may help your students see what wavelength is for a given wave.
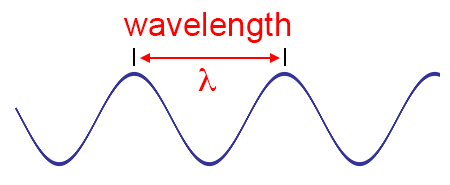
Diagram showing what wavelength is for a wave. (Credit: NASA's Imagine the Universe)
Tells students that frequency is the number of complete waves, or wavelengths, that pass a given point each second. All light travels at the same speed, but each color has a different wavelength and frequency. It is their different wavelengths that cause the different colors of light to separate and become visible when passing through a prism.
Show students the illustration below, or something similar.
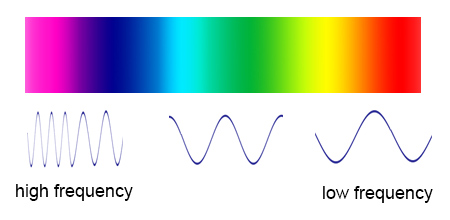
Diagram showing the relative frequency of the different parts of the visible spectrum. The waves are not shown to scale. (Credit: NASA's Imagine the Universe)
Ask students, based on the illustration above, to guess which color has the longest wavelength? The answer is red. The wavelengths of the other colors decrease in order, with violet light having the shortest wavelength.
Tell students that in this hands-on lab, they will construct a simplified model of different light waves in order to determine a constant relationship between wavelength and frequency.
Procedure
Hand out the procedure sheet to each group in order for them to see the instructions along with hearing them.
- Triad decides who is:
- Data Keeper / Reader
- Materials Manager / Checker
- Time Keeper / Facilitator
- Materials Manager retrieves all materials listed from teacher. Reader should read all directions.
- Recorder should draw a vertical line about 20 cm from the beginning of the adding machine tape and label it "Start". With the metric ruler, make a point 100 cm from the starting point. Draw a vertical line and label it "End". Cut the tape off of the roll leaving about 20 cm space between "End" and where you cut.
- Next, Materials Manager draws three evenly spaced horizontal
lines using colored pencils to draw along the tape from Start to
End. Make the top line red, the middle line green and the bottom
line violet to represent three different colors in the spectrum of
light.
Note: The Time Keeper/ On Task Coordinator should continually keep everyone focused in order to complete this lab. He or she may also share in the completion of the tasks.
- Recorder divides the red line every 14 cm with dark marks in red
pencil. The green line should be divided every 10 cm and the violet
every 8 cm. The marks that you make on the three color lines will
represent the different wavelengths of the different colors of
light.
Note: The true wavelengths are actually measured in terms of angstroms. An angstrom is 10-8 cm or 0.00000001 cm. Red has a wavelength of 7800-6220 angstroms, green has a wavelength of 5770-4920 angstroms and violet has a wavelength of 4550-3900 angstroms. However, in this lab, the simple relationship among the visible light waves will be what is important.
- Materials Manager fastens the marked adding machine tape to a pencil using masking tape.
- Recorder cuts a manila folder along its crease. Then cuts a rectangle out of the center of one of the long sides. This rectangle should be about 10 cm high and 5 cm wide as shown below.
- Materials Manager sets the manila folder with the cut out on the table, supporting it with the four books as shown in the diagram below. Now s/he feeds the end of the adding machine tape through the narrow space between the manila folder and the two back books until "Start" appears in the middle of the opening in the manila folder.
- Recorder takes the Data Table and sits in front of the tape and manila folder model.
- Time Keeper calls "start" and begin timing as he or she slowly pulls the tape along. S/he should try to pull the tape at about the same speed for every trial!
- Recorder tallies in the appropriate box on the data table every time s/he sees a wavelength mark. When "End" appears, s/he tells the Time Keeper to stop timing.
- Each Triad makes one "trial run" and then repeats the procedure an additional 3 times.
- On the data table, Materials Manager determines and records the average number of wavelengths observed for each color and the average time (in seconds) from start to finish.
- Recorder determines and records the frequency for each of the colored light waves. Note: frequency is defined as the number of wavelengths passing a given point per second.
Diagram showing how to label the tape. (Credit: NASA's Imagine the Universe)
Diagram showing the cutout on the manila folder should look. (Credit: NASA's Imagine the Universe)
Diagram showing the setup for this lab. (Credit: NASA's Imagine the Universe)
Independent Practice
Hand out the wrap-up worksheet to each student and have each student fill it out individually.
Assessment
Formative assessment and observation should be evident throughout the lesson. The worksheet, final questions during closure or a future quiz may serve as summative assessment.
Closure
Direct students to write for five minutes in their journals summarizing the lab and all procedures in this lesson. Encourage students to then share their findings and what they might have written in their journals.
References
The general idea for this lesson plan was adapted from a lesson written by Dr. Charles W. McLaughlin which was found in Science Experiments on File.
