Answer Key for
Cosmic Abundances Activity
This activity provides practice for reading and interpreting the log plot of solar system elemental abundances.
- Refer to the chart of the solar system abundances
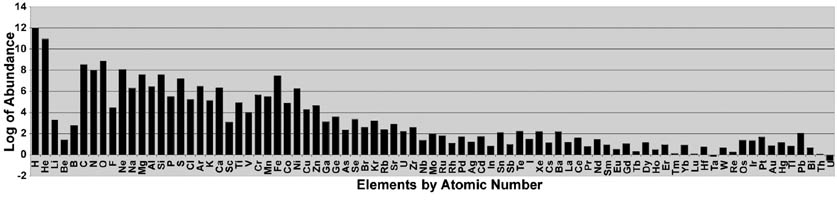
From the plot, determine the abundances of the following elements:
The abundances can be read directly from the figure, keeping in mind
that the logarithm of the abundance is plotted.
- Hydrogen
If NH represents the abundance of hydrogen, then the plots shows Log NH = 12. Inverting the logarithm gives the abundance of hydrogen as NH = 1012.
- Helium
Likewise, Log NHe = 11, and NHe = 1011.
- Aluminum
Log NAl = 6.5, and NAl = 3.16 x 10⁶.
- Gold
Log NAu = 1.0 (estimating from the plot) and NAu = 10.
To compare the abundance of an element relative to hydrogen, take the ratio of the abundances:
5. How much more hydrogen is there in the solar system than
helium?
To compare the abundance of helium to that of hydrogen, compute 1012/1011 = 10. So there is 10 times more hydrogen than helium. This can also be done using logarithms,
Log (NH/NHe) = Log NH - Log NHe = 12 - 11 = 1.
Inverting the result gives Log 1 = 101 = 10.
6. How much more hydrogen is there than aluminum?
Likewise, for hydrogen and aluminum, compute 1012/(3.16 x 106) = 3.16 x 10⁵, or
Log (NH/NAl) = Log NH - Log NAl = 12 - 6.5 = 5.5,
There is log 5.5 = 105.5 = 3.16 x 10⁵ times as much hydrogen as aluminum.
7. How much more hydrogen is there than gold?
For hydrogen and gold, compute 1012/10 = 1 x 10¹¹, or
Log (NH/NAu) = Log NH - Log NAl = 12 - 1 = 11,
There is log 11 = 1 x 10¹¹ times as much hydrogen as
gold.
Below is a table of the various processes in the universe that create elements. Also listed are the combined abundances (relative to hydrogen) of that particular groups of elements.
| Process | Predominant elements | Combined
Abundance |
| Big Bang | H, He | 1.10 x 10¹² |
| Small Stars | C,N,O | 1.19 x 10⁹ |
| Large Stars | other elements with atomic
numbers up through Fe | 2.56 x 10⁸ |
| Supernovae elements | with atomic numbers
above Fe | 1.94 x 10⁶ |
| Cosmic Rays | Li, Be, B | 2.68 x 10³ |
What are ways to illustrate or plot these data?
Because of the wide range of values, data like this are often plotted logarithmically. The Solar System abundance bar graph is an example of this. These values may likewise be plotted in a bar graph, or as a line graph, with the y-axis for the abundance plotted logarithmically.
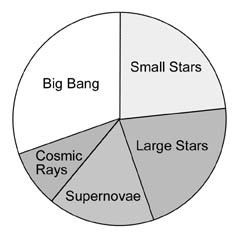
Another way to plot it is to add all the logarithmic values
(12+9+8+6+3=38), and represent each particular process as a fraction
of the total. So H and He from the big bang are 12/38=32 % of the
total. A pie chart can be constructed to represent these
percentages. This is what's been done along the rim of the circle on
the "What is Your Cosmic Connection to the Elements?" poster.
|
|
Pie chart representing the "logarithmic percentages" of each process.
|
|
