Supernova Chemistry Lesson Plan
Supernova Chemistry
Suggested grade levels: 9-12
Estimated class time: 2-3 class periods
Lesson plan by Jane Mahon and Ron Dodson of Hoover High School in Hoover, Alabama
Summary
This lesson gives the student an opportunity to identify elements by using spectroscopy and to relate this activity to astrophysics. Students will use spectrometers to measure the spectra of various light sources at 10 different lab stations.
Objective
- Students will observe visible spectra of known elements and identify an unknown element or combination of elements by visible spectra.
National Education Standards
National Science Education Standards
This lesson plan addresses the following National Science Education Standards:
NS.9-12.1 Science as Inquiry
As a result of activities in grades 5-8, all students should develop:
- Abilities necessary to do scientific inquiry
- Understandings about scientific inquiry
NS.9-12.2 Physical Science
As a result of their activities in grades 9-12, all students should develop an understanding of:
- Structure of atoms
- Interactions of energy and matter
NS.9-12.4 Earth and Space Science
As a result of activities in grades 5-8, all students should develop an understanding of:
- Origin and evolution of the universe
Prerequisites
- Math
- Students should be proficient in Algebra, especially in the areas of pattern recognition
- Students should be proficient with the metric system of measurement.
- Science
- Students should have had an introduction to the electromagnetic spectrum, the concepts of wavelength, frequency, and quantization of energy.
- Students should have had an introduction to the Bohr model of the atom.
- Students should be proficient at making observations, making measurements, discovering patterns, and drawing conclusions from those observations, measurements, and patterns.
Materials
- 10 spectroscopes
- 5 spectrum tubes (one of these should be mercury)
- 5 spectrum tube power supplies
- 1 incandescent light bulb
- 1 "plant grow" light bulb
- 1 Compact Fluorescent light fixture
- 4 Chemical Light Sticks (each lasts four hours)
- 1 Standard Fluorescent light tube
- 10 Packages of colored pencils
- 10 Student procedure worksheets (html, Word, PDF)
- Student question worksheets, one for each student (html, Word, PDF)
Introduction
Electromagnetic radiation is characterized by its wavelength, frequency, and intensity. These measurable quantities can be used to determine the temperature, density, and composition of the matter that emits the radiation. These measurable quantities can also be used to understand the events which trigger the release of the radiation. When Isaac Newton passed a beam of sunlight through a prism in 1666, a continuous spectrum of light was seen. Light began to reveal its secrets, and a special window of understanding was opened for the first time. Analysis of this kind of information gives scientists a window to study the atom and the stars. This window is called spectroscopy.
During the nineteenth century, experimenters found that the dark lines in the Sun's spectrum and the bright lines in the spectra of incandescent gases in the laboratory matched. The window opened a little wider. During the early twentieth century useful models of the atom emerged which are still used to explain the special signature of spectral lines each element emits when heated or energized by electrical discharge. As our window inside the atom widened so did our ability to analyze all types of radiation emitted by stellar objects. Detection devices have become steadily more sophisticated giving us more information about objects which are not even visible with the best telescopes on Earth.
High resolution spectrum of the Sun. Click image for a larger version. (Credit: N.A.Sharp, NOAO/NSO/Kitt Peak FTS/AURA/NSF)
X-ray measurements provide the most direct probes of astrophysical environments with temperatures exceeding one million degrees Kelvin. Such temperatures are encountered frequently in the cosmos: in supernovae, binary accretion, stellar coronae, just to make a few. In this lesson, we are interested in what X-ray spectroscopy can tell us about supernova explosions.
X-ray spectrum of supernova remnant Cas A from ASCA data. (Credit: Holt et al., PASJ 1994)
Supernova explosions are believed to be the primary mechanism for the production and dispersal of heavy elements into the interstellar medium (ISM). They are also believed to be the origin of cosmic rays. The quest to understand these processes has driven the development of X-ray spectroscopy.
The X-ray spectrum of a supernova contains lines emitted from the non-equilibrium, shocked gas sent out into space by the explosion. Examining the intensity and width of a line, the relative appearance of resonance, intercombination, and forbidden lines from a given element, and the underlying continuum energy... all of these things give us insight into the extreme conditions resulting from a supernova explosion. They can lead us to an understanding of where all of the heavy elements in our Universe came from, and how they got to be where they are now.
Give
me a basic description of supernovae and their remnants
Give
me a more advanced description of supernovae and their remnants
Guided Practice
Show students the image below of the Crab Nebula as seen in different wavelengths. Also direct them to the Advanced Multiwavelength Astronomy page, which discusses what astronomers see in each of the depicted wavelengths. Have students write at least five questions about the images and the ideas presented on the webpage.
The Crab Nebula in optical, radio, infrared, ultraviolet, and X-ray wavelengths.
Have students pair-share their questions, and then have each pair report one of their questions to the rest of the class.
Procedure
-
Prior to the lab, discuss the basic principles of spectrscopy. Basically, students should understand that every type of atom has a unique electron configuration, that the position of an electron affects how much energy it has, and that this causes different substances to interact with light in different ways. An understanding of the Bohr model of the atom should suffice.
Make sure that students understand the incredible number of ways that spectroscopy is used: X-ray spectroscopy, Atomic Emission spectroscopy, Infrared spectroscopy, Nuclear Magnetic Resonance imaging (NMR), and UV spectroscopy. Most of the components in the Hubble Space Telescope are related to spectroscopic analysis.
Tie the discussion back to the images of the Crab Nebula that they looked at by explaing to students that the different wavelengths of light astronomers see from objects can tell them what elements are present in that object. So we can know what elements are in an object light years away without ever visiting that object!
- Assign students to lab groups. There are 10 lab stations, so there should be 10 lab groups.
-
Hand out the student procedure worksheet to each group. Discuss the lab procedure with students before allowing them to begin data collection.
Caution students strongly about the need to avoid touching the gas tubes or the electrical power units. There is a very real chance that they could be burned or electrocuted if they directly touch the tubes. Make sure that the units are plugged into the GFI outlets.
Also emphasize that students need to keep safety glasses on throughout the activity. The gas tubes get very hot, and they can burst. Use a fluorescent light strip in the lab or an adjacent area as the fluorescent source.
Tell students that they will have 4 minutes at each station. This will allow the data collection to be completed in one class period. Adjust if your class period is shorter or longer. Also, if you know that your class will need more time, then you will need to allow additional time on a second day for data collection.
At each station, one student should observe the spectrum through the spectrometer and call out the bright line wavelengths to their group. The other members of the group should double-check the line positions, and they should all agree before they use the colored pencils to shade in the areas of their spectrum.
Note that some of the tubes will produce just line spectra, but most will have some degree of continual spectrum. This is because of the limited resolution of the diffraction grating used in the spectrometers. Students should concentrate on the bright lines, and not get caught up in the continuum emission.
The chemical light sticks will need to be changed when they begin to grow dim.
Please note: About 1 out of 12 boys experience some degree of color-blindness. Usually, they should be able to see the bright lines, but they might misinterpret the color or think it's "white" light. Each pair of students should double-check each other, and avoid boy-boy pairs as much as possible. Many boys are unaware by this age that they may have a problem with particular colors, so be sensitive to the fact that some may discover their color-blindness during this activity. The rate of color-blindness is much lower in girls (about 1 in 200), so there is a smaller chance of this affecting the girls in your class.
- Allow students to take their data. Remember to keep students on a schedule. Giving them 4 minutes at each station should allow the data collection to be completed in one class period.
-
Allow students to compare their spectra for different tubes with other groups, and encourage them to discuss the differences and similarities. Ask students to draw relationships between what they said about light after the engagement activity and what they discovered about light during the laboratory activity.
Talk to students about the many different ways in which spectroscopy is used by modern scientists. Spectrometers of various forms represent the most important single group of lab instruments in the research lab today.
- Hand out the student question worksheets to each student and have them answer the questions on their own.
Assessment
Formative assessment and observation should be evident throughout the lesson. The worksheet, final questions during closure or a future quiz may serve as summative assessment.
Closure
Direct students to write for five minutes in their journals summarizing the lab and all procedures in this lesson. Encourage students to then share their findings and what they might have written in their journals.
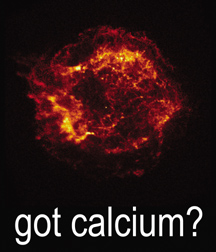
The Cas A supernova remnant as seen in light emitted by calcium. (Credit: NASA/CXC/SAO)
You may want to share the Got Calcium? lithograph with the class. This image shows the Cas A supernova remnant as seen in light emitted by calcium. Astronomers know that the light is from calcium based on spectroscopy, in the same way your students identified elements in the lights used in this lab.
References
- This experiment was adapted from "Spectroscopy Lab", Chemistry Laboratory Manual, Prentice Hall, 1996, pp. 61-66.
