Instead of using our spectrometer on a light bulb, what if we were to use it to look a tube of gas – for example, hydrogen? We would first need to heat the hydrogen to very high temperatures, or give the atoms of hydrogen energy by running an electric current through the tube. This would cause the gas to glow – to emit radiation. If we looked at the spectrum of light given off by the hydrogen gas with our spectroscope, instead of seeing a continuum of colors, we would just see a few bright lines. Below we see the spectrum, the unique fingerprint of hydrogen.

These bright lines are called emission lines. Remember how we heated the hydrogen to give the atoms energy? By doing that, we excited the electrons in the atom – when the electrons fell back to their ground state, they gave of photons of light at hydrogen's characteristic energies. If we altered the amount or abundance of hydrogen gas we have, we could change the intensity of the lines, that is, their brightness, because more photons would be produced. But we couldn't change their color – no matter how much or how little hydrogen gas was present, the pattern of lines would be the same. Hydrogen's pattern of emission lines is unique to it. The brightness of the emission lines can give us a great deal of information about the abundance of hydrogen present. This is particularly useful in a star, where there are many elements mixed together.
Each element in the periodic table can appear in gaseous form and will each produce a series of bright emission lines unique to that element. The spectrum of hydrogen will not look like the spectrum of helium, or the spectrum of carbon, or of any other element.


We know that the continuum of the electromagnetic spectrum extends from low-energy radio waves, to microwaves, to infrared, to optical light, to ultraviolet, to X-ray and gamma rays. In the same way, hydrogen's unique spectrum extends over a range, as do the spectra of the other elements. The above spectra are in the optical range of light. Line emission can actually occur at any energy of light (i.e. visible, UV, etc. ) and with any type of atom, however, not all atoms have line emission at all wavelengths. The difference in energy between levels in the atom is not great enough for the emission to be X-rays in atoms of lighter elements, for example.
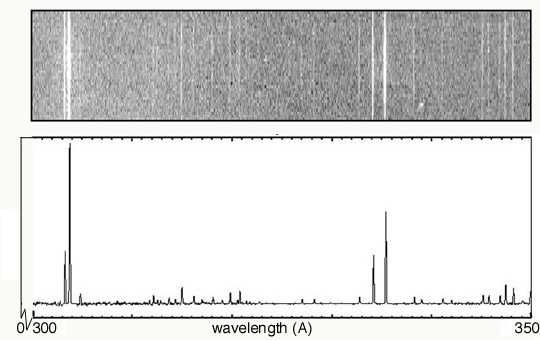
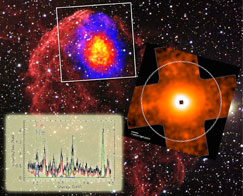
The sample spectra above represent energy emission as lines, the amount of photons of light represented by the brightness and width of the line. But we can also make a graphical representation of a spectrum. Instead of the emission of a characteristic energy being shown as a line, it can be shown as a peak on a graph. In this case, the height and width of the peak show its intensity. One example of this is the very first spectrum we looked at – the one of the supernova remnant. The peaks and bumps on the graph are simply a graphical representation of the emission lines of different elements.
Below, you will see the spectrum of the Sun at ultraviolet wavelengths. There are distinct lines (in the top graph) and peaks (in the bottom one) and if you look at the x-axis, you can see what energies they correspond to. For example, we know that helium emits light at a wavelength of 304 Ångstroms, so if we see a peak at that wavelength, we know that there is helium present.