Imagine the Universe: Spectral Analysis Appendix
Appendix
Color and Stars
Background Sheet
- Color can tell us about substances that make up stars.
- A spectroscope is used to analyze the light from stars.
- The spectroscope separates light into a spectrum, or bands of different colors).
- The spectrum of a star reveals dark bands across the colors.
- The bands are there because some wavelengths of light have been absorbed by gases in the star's atmosphere.
- The bands of each element look different. Each produces its own pattern. ("like a bar code", page 464)
- From the patterns produced by stars, scientists can tell which elements are present in the stars.
The following is from NASA's Imagine the Universe web site: http://imagine.gsfc.nasa.gov/science/toolbox/spectra1.html
What Can Scientists Learn From a Spectrum?
It took a long time for scientists to learn how to use a spectrum to gain insight into the universe. Isaac Newton (1642-1727) saw the spectrum from sunlight as a continuous band of colors. In 1802, William Wollaston (1766-1828) observed several dark lines in the spectrum of the Sun. He thought they represented natural divisions between the colors. Joseph von Fraunhofer (1787-1826) looked at sunlight with an even better prism. He saw 600 such dark lines in the spectrum. Then finally, Gustav Kirchhoff (1824-1887) figured out what was going on and gave the world a set of rules describing what was making both the continuous spectrum that Newton saw and the dark lines that Fraunhofer saw.
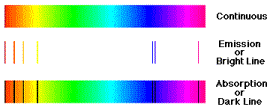
Rule #1: A luminous solid or liquid emits a continuous spectrum of all wavelengths. It has no lines in it.
Rule #2: A rarefied luminous gas emits light whose spectrum shows bright lines. These lines are called emission lines.
Rule #3: If the light from a luminous source passes through a gas, the gas may extract certain specific energies from the continuous spectrum. We then see dark lines where the energy has been removed. These dark lines are called absorption lines.

The science of spectroscopy is quite sophisticated. From spectral lines astronomers can determine not only the element, but the temperature and density of that element in the star. The spectral line also can tell us about any magnetic field of the star. The width of the line can tell us how fast the material is moving. We can learn about winds in stars from this. If the lines shift back and forth we can learn that the star may be orbiting another star. We can estimate the mass and size of the star from this. If the lines grow and fade in strength we can learn about the physical changes in the star. Spectral information can also tell us about material around stars. This material may be falling onto the star from a doughnut-shaped disk around the star called an accretion disk. These disks often form around a neutron star or black hole. The light from the stuff between the stars allows astronomers to study the interstellar medium (ISM). This tells us what type of stuff fills the space between the stars. Space is not empty! There is lots of gas and dust between the stars. Spectroscopy is one of the fundamental tools which scientists use to study the Universe.

