How Far? How Powerful?
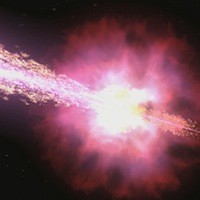
How Far? How Powerful?
Suggested grade levels: 11-12
Estimated class time: 2 class periods
Lesson plan by Laura Whitlock, Kara Granger, and Padi Boyd
Summary
These activities invite you to journey with your students to gamma-ray bursts – distant explosions that briefly outshine the rest of the gamma-ray Universe! Your students will follow the same procedures used by today's astronomers to determine how far away and how powerful gamma-ray bursts truly are.
Objectives
- Students will reinforce their knowledge of basic physics concepts (light, the electromagnetic spectrum) and chemistry concepts (spectral lines, spectroscopy)
- Students will learn about Hubble's Law and how this allows astronomers to measure the distance to faraway objects.
- Students will learn to combine these physics and chemistry concepts to answer a fundamental question about a mysterious phenomenon in our universe (gamma-ray bursts).
National Education Standards
National Science Education Standards
This lesson plan addresses the following National Science Education Standards:
NS.9-12.1 Science as Inquiry
As a result of activities in grades 5-8, all students should develop:
- Abilities necessary to do scientific inquiry
- Understandings about scientific inquiry
NS.9-12.2 Physical Science
As a result of their activities in grades 9-12, all students should develop an understanding of:
- Structure of atoms
- Conservation of energy and increase in disorder
- Interactions of energy and matter
NS.9-12.4 Earth and Space Science
As a result of activities in grades 5-8, all students should develop an understanding of:
- Origin and evolution of the universe
National Council of Teachers of Mathematics
This lesson plan addresses the following educational standards from the National Council of Teachers of Mathematics:
- Process Standards
- Problem Solving
Instructional programs from prekindergarten through grade 12 should enable all students to:- build new mathematical knowledge through problem solving
- solve problems that arise in mathematics and in other contexts
- Connections
Instructional programs from prekindergarten through grade 12 should enable all students to:- recognize and apply mathematics in contexts outside of mathematics
- Problem Solving
- Number and Operations
- Understand numbers, ways of representing numbers,
relationships among numbers, and number systems
In grades 9-12 all students should:- develop a deeper understanding of very large and very small numbers and of various representations of them
- Understand numbers, ways of representing numbers,
relationships among numbers, and number systems
- Algebra
- Represent and analyze mathematical situations and
structures using algebraic symbols
In grades 9-12 all students should- understand the meaning of equivalent forms of expressions, equations, inequalities, and relations
- use symbolic algebra to represent and explain mathematical relationships
- Use mathematical models to represent and
understand quantitative relationships
In grades 9-12 all students should- identify essential quantitative relationships in a situation and determine the class or classes of functions that might model the relationships
- use symbolic expressions, including iterative and recursive forms, to represent relationships arising from various contexts
- Represent and analyze mathematical situations and
structures using algebraic symbols
- Measurement
- Understand measurable attributes of objects and
the units, systems, and processes of measurement
In grades 9-12 all students should- make decisions about units and scales that are appropriate for problem situations involving measurement
- Apply appropriate techniques, tools, and formulas
to determine measurements
In grades 9-12 all students should- use unit analysis to check measurement computations
- Understand measurable attributes of objects and
the units, systems, and processes of measurement
Prerequisites
- Math
- Students should be proficient in Algebra.
- Students should be proficient with the metric system of measurement and units conversions.
- Science
- Students should have had an introduction to the electromagnetic spectrum, the concepts of wavelength and frequency.
Materials
- For each lab group:
- scissors
- tape measure
- tape
- single-hole hole punch
- dark orange or dark red paper (at least 7 cm x 7 cm)
- flashlight with a well focused emission of light and light end no more than 5cm in diameter
- graphing calculator or computer software that can perform a power regression on a set of data
- Handouts:
Introduction
Gamma ray bursts are fast, intense bursts of gamma rays and are the most energetic events in the Universe. They travel clear across the universe from distant galaxies to our detectors in low Earth orbit. But how do we know how far away these objects are?
The activities presented in this lesson plan allow your students to use the same methods as today's astronomers to discover for themselves the distance to a gamma-ray burst. To do this, they will need to review some basic physics concepts about light, learn about redshifted spectra and Hubble's Law, and put all of this information together.
This lesson plan proceeds through the following set of activities:
- Introduce the students to the big idea: what we know from stars and galaxies is all based on what we measure using detectors either on Earth or in orbit. How do we go from this information to an estimate of how far away the objects are, and how much power they are putting out? Let students brainstorm possible paths to these answers.
- Students measure how light falls off over distance. Your class might break up into several groups, whose results could be averaged together. How close did your class come to the actual behavior of one over r-squared?
- Present the information found in Introduction to Hubble's Law and the Doppler Shift. The central, most important concept to get across is that Hubble discovered that the further a galaxy is from Earth, the greater its redshift – i.e. the faster it is receding from us. We can turn this idea around: if we measure the redshift of an object we can calculate its distance from Earth.
- Finally, bring all of these concepts together by having your class analyze a Keck Observatory spectrum of a real gamma-ray burst. Students will use real astronomical data to measure the redshift of the gamma ray burst, and then use this information to estimate its distance from Earth. The final step of this activity applies the 1/r2 fall-off of light, the distance to the object, and the power measured at our detector, to estimate the total power emitted by the gamma ray burst.
Guided Practice: Fall-off of light
Ask students to imagine that they saw a light on a dark night. How would they know how far away that light was? What would they need to know? How would they know the difference between a flashlight that was a few hundred meters away or a headlight a couple kilometers away? They would need to know how bright the original source was.
Astronomers often use an object's "apparent magnitude," or how bright the object appears, coupled with a measure of the object's distance to determine its "absolute magnitude", or how bright the object really is.
Tell your students that they they are astronomers who have collected light from a faraway source. Their detector is in orbit around Earth and has measured a certain amount of energy from this source. Their job is to determine how much energy the source actually emitted. They can assume the source emits energy equally in all directions.
If a light source emits light equally in all directions, what does this mean about the amount of light we will measure in any given square cm as we move further and further away from the light source?
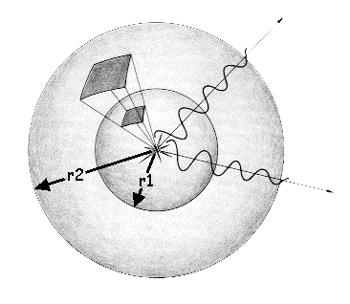
A light source, at the center of this image, emits light equally in all directions. Moving away from the source, that light encompasses a larger and larger surface. This is the basis of the 1-over-r-squared law (or 1/r2 law).
Think of light as a wave traveling away from the source. At a distance r1 from the source, all the energy from the light is found on a spherical surface with radius r1. The area of such a sphere would be:
As the wave continues to travel away from the source to a distance of r2, the light is then all found on a spherical surface whose area is:
Keep in mind that the total amount of light emitted by the source, let's call it L, is constant. What is changing as we move away from the source is the area over which it is spread.
Let us then compare the amount of light per unit area at a distance of r1 to that at r2. At r1, the light per unit area, L1, is equal to:

And at r2, the light per unit area, L2, is equal to:

Solving each equation for L gives:
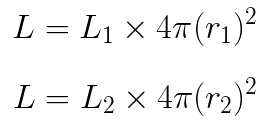
So the amount of light per unit area at L1 relative to the amount of light per unit area at r2 is then:

Think about what this means. If r1 is 5 cm and r2 is 10 cm, then there is 1/4 as much light per square cm at r2 as at r1. So the distance changed by a factor of 2, but the amount of light per square cm changed by a factor of 4. What if r1 was 5 and r2 was 50? How much less light per square cm do you have there?
We say that the intensity, or amount of light per square cm, changes as 1/distance squared (i.e., 1/r2) away from the source. This is just one step for how astronomers determine the distance and power of faraway objects. If we measure X amount of energy per square cm in our detector, then we know that the source must have emitted energy equal to 4 π r2 times X!
Measuring Light Fall-off
Students will now prove that light really does fall off as 1/r2. Below we describe a quick and easy way to do this. If you would rather have your students performa a more rigorous measurement, try the Just How Far is that Star? lesson plan from our Cosmic Times materials.
The steps below are also enumerated on the Fall-off of light procedure worksheet . Have students break up into lab groups. and complete the procedure below.
- Each lab group should pick up the following from the teacher:
- scissors
- tape measure
- tape
- single-hole hole punch
- dark orange or dark red paper (at least 7 by 7cm)
- flashlight with a well focused emission of light and light end no more than 5 cm in diameter
- graphing calculator or computer with software to perform a power regression on your data
- Find a blank, flat wall to shine a light onto and a table or chair that can stabilize the flashlight for this lab. If you have a nice blank wall near the end of a lab table, you can just put the light on top of the table. You will need to be able to move the light (whether along the table or by moving the chair) at least 1 meter in distance closer to or away from the wall.
- Use the hole punch to punch a hole in the center of the dark orange or dark red paper.
- Tape the paper to the light end of the flashlight, making sure the hole is roughly centered over the light.
- Place the flashlight on the chair or table at least 10 cm from the wall. You can adjust it with papers or books so that it is level (i.e., the light beam shines perpendicular on the wall). Measure the distance from the wall to the hole on the front of the flashlight. Record this distance in your data table.
- Turn the flashlight on. You should see a distinct white circle projected on the wall. The rest of the light emitted outside of this light should be a shade of the colored paper taped to the flashlight.
- Take 3 different measurements of the diameter of the circle of white light on the wall. HINT: Remember, the diameter of a circle is the longest measured chord from one edge of the circle to the other. Therefore, you know you've got the diameter when you hold one end of the tape measure on one side (edge) of the circle and get the largest measured value by moving the other end of the tape measure along the other side.
- Record these values in the data chart. Calculate the mean and record it as well.
- Move the chair with the flashlight (or move along the table) about 20 cm further away from the wall. Measure the distance from the wall to the hole on the front of the flashlight. Record this distance on your data table.
- Repeat steps 6-8 at least two more times.
- Calculate the radius from each mean diameter. Record each calculation in the data table.
- Calculate the area of the circle formed from each calculated radius. Record each calculation in the data table. HINT: Area of a circle equals π r2.
- In your graphics calculator, enter the distance from the hole to the wall as one list and the area of each calculated circle as another list.
- Plot the data in the lists as a scatter plot. What kind of relationship do you see?
- Calculate a Power Regression equation on the two lists. What is the equation?
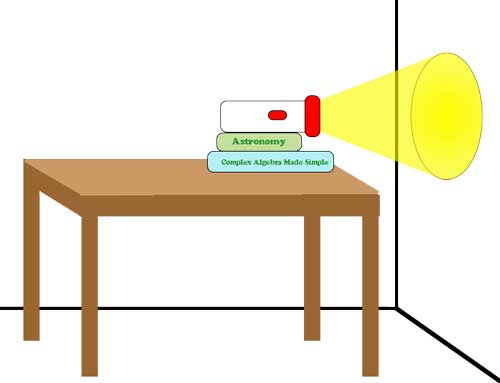
Illustration of the lab set-up. (Credit: NASA/Imagine the Universe)
Guided Practice: Hubble's Law and Doppler Shift
During the 1920s and 30s, Edwin Hubble discovered that the Universe is expanding, with galaxies moving away from each other at a velocity given by an expression:
where v represents the galaxy's recessional velocity, d is its distance away from Earth, and Ho is a constant of proportionality called Hubble's Constant.
This equation is known as Hubble's Law. The exact value of the Hubble Constant is still somewhat uncertain. Hubble's first determination of it was a value of 550 kilometers per second for every megaparsec in distance (km/sec/Mpc), where a megaparsec is equal to 3 \times 106 light-years. Today, it is generally believed to be around 70 km/sec/Mpc. This means that a galaxy 1 Mpc away will be moving away from us at a speed of around 70 km/sec, while another galaxy 100 Mpc away will be receding at 100 times this speed. In essence, the Hubble Constant reflects the rate at which the Universe is expanding.
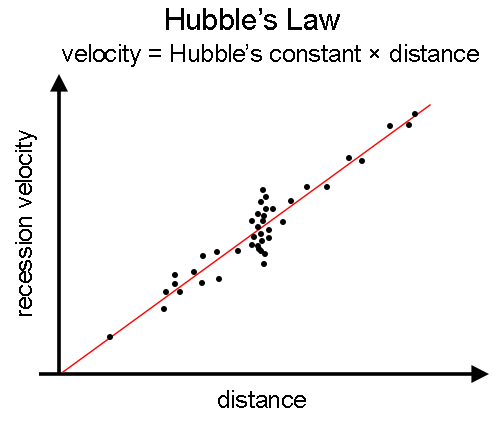
Plot of recession velocity versus distance for galaxies, showing the basis of Hubble's law. The further a galaxy is away, the faster it is receding from us. Therefore, if we know how fast a galaxy is moving, we can determine its distance using this plot.
While there is certainly some scatter of measured observations off the line of best fit for Hubble's Law, it is nevertheless a good way to get a rough idea of how far away a very distant object is from Earth. All we need to do is to be able to determine the object's velocity.
The velocity is relatively easy for us to measure using the Doppler effect, or Doppler shift. An object in motion will have its radiation (i.e. light) shifted in wavelength according to the following formula:

where λ is the measured wavelength, λ0 is the original (rest) wavelength, v is the speed of the object and c is the speed of light. The quantity on the left side of the equation above is usually called the redshift, and is denoted by the letter "Z".
Wavelengths can be measured in any units – angstroms (10-10 meters), nm, mm, or km. As long as λ - λ0 and λ are in the same units, they will cancel. The speed of light has a constant value of 300,000 km/sec. So, to determine the velocity of a galaxy (in km/sec) from its spectrum, we simply measure the wavelength shift of a known absorption line and solve for v.
Example: A certain absorption line that is found at 5000 angstroms in the lab is found at 5050 angstroms when analyzing the spectrum of a particular galaxy. We then conclude that this galaxy is moving with a velocity v = (50/5000) * c = 3000 km/sec away from us.
Putting it all together now, if the object is moving away from us at 3000 km/sec, its distance from us (according to the Hubble Law) is:

Independent Practice: Putting it all Together
Using optical data of a gamma ray burst afterglow, students will put together all of the information in this lesson to determine the power of a gamma-ray burst. First, students will measure the velocity of the object from the redshifts of its spectral lines. Then they will use Hubble's Law to determine the distance to this object. Finally, they will estimate the power of the gamma ray burst from its measured flux at Earth and its distance from us.
Hand out the Keck Spectrum worksheet to your students and have them work through the problem on the worksheet to determine the power of GRB980703.
Assessment
Formative assessment and observation should be evident throughout the lesson. The worksheet, final questions during closure or a future quiz may serve as summative assessment.
Closure
Direct students to write for five minutes in their journals summarizing the lab and all procedures in this lesson. Encourage students to then share their findings and what they might have written in their journals.
References
- This experiment was adapted from "Spectroscopy Lab", Chemistry Laboratory Manual, Prentice Hall, 1996, pp. 61-66.

