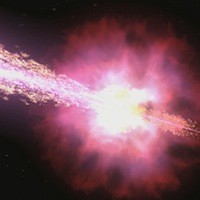
Supernova Chemistry Lesson Plan
How Far? How Powerful?
Fall-off of Light
Team Members: __________________________________
Date: ______
Class: _______________________
Summary
Your teacher has just gone over a calculation showing that the intensity of light decreases as you move away from the light source. It does this with a very specific relationship with your distance from the light – as 1/r2. You are going to prove that relationship!
Materials
- scissors
- tape measure
- tape
- single-hole hole punch
- dark orange or dark red paper (at least 7 by 7cm)
- flashlight
- graphing calculator or computer to perform a power regression
Procedure
- Pick up the listed materials from your teacher.
- Find a blank, flat wall to shine a light onto and a table or chair that can stabilize the flashlight for this lab. If you have a blank wall near the end of a lab table, then put the light on top of the table. You will need to be able to move the light (whether along the table or by moving the chair) at least 1 meter closer to or away from the wall.
- Use the hole punch to punch a hole in the center of the dark orange or red paper.
- Tape the paper to the light end of the flashlight, making sure the hole is roughly centered over the light.
- Place the flashlight on the chair or table at least 10 cm from the wall. You can adjust it with papers or books so that it is level (i.e., the light beam shines perpendicular on the wall). Measure the distance from the wall to the hole on the front of the flashlight. Record this distance in your data table.
- Turn the flashlight on. You should see a distinct white circle projected on the wall. The rest of the light emitted outside of this light should be a shade of the colored paper taped to the flashlight.
- Take 3 different measurements of the diameter of the circle of white light on the wall. HINT: Remember, the diameter of a circle is the longest measured chord from one edge of the circle to the other. Therefore, you know you've got the diameter when you hold one end of the tape measure on one side (edge) of the circle and get the largest measured value by moving the other end of the tape measure along the other side.
- Record these values in the data chart. Calculate the mean and record it as well.
- Move the chair with the flashlight (or move along the table) about 20 cm further away from the wall. Measure the distance from the wall to the hole on the front of the flashlight. Record this distance on your data table.
- Repeat steps 6-8 at least two more times.
- Calculate the radius from each mean diameter. Record each calculation in the data table.
- Calculate the area of the circle formed from each calculated radius. Record each calculation in the data table. HINT: Area of a circle equals π r2.
- In your graphics calculator, enter the distance from the hole to the wall as one list and the area of each calculated circle as another list.
- Plot the data in the lists as a scatter plot. What kind of relationship do you see?
- Calculate a Power Regression equation on the two lists. What is the equation?
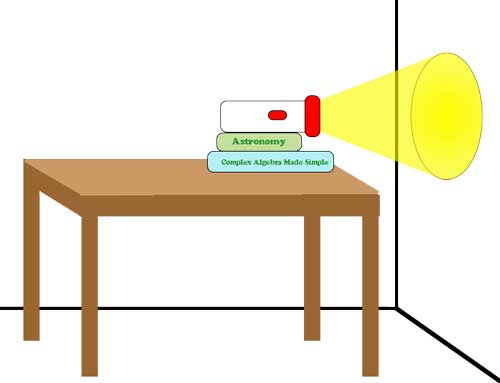
Illustration of the lab set-up. (Credit: NASA/Imagine the Unvierse)
| Measurement | Distance (cm) | Diameter of light circle (cm) | Radius (cm) | |||
| Trial 1 | Trial 2 | Trial 3 | Average | |||
| 1 | ||||||
| 2 | ||||||
| 3 | ||||||
