Lesson Plans: Stars and Slopes
 |
Stars and Slopes |
Day 1 focuses on log-log plotting and determining the slopes of such plots.
Materials
| Teacher | Students |
|---|---|
| overhead to emphasize points in intro and throughout lesson | copies of all plots and charts of data |
| copies of all plots and charts of data | few sheets of log-log and Cartesian graph paper |
Engagement
(pdf version available)
NOTE: Reading pdf files requires the Adobe Acrobat Reader, which is available for free download from http://www.adobe.com/products/acrobat/readstep.html.
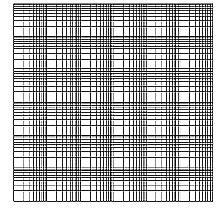
 | Show me a
bigger version of this paper! |
The following data have been gathered from an experiment meant to determine the relationship which exists between the diameter of a ring and its period as a pendulum. Five steel rings with varying diameters were individually suspended from a knife edge mounted on the wall, and caused to swing back and forth about this axis. Each diameter was measured, and each period was determined by measuring the number of cycles per unit of time.
| Ring Diameter (cm) | 3.51 | 7.26 | 13.7 | 28.5 | 38.7 |
|---|---|---|---|---|---|
| Time for Completing 25 Swings (sec) | 9.35 | 13.3 | 19.2 | 26.98 | 32.88 |
We expect these data to follow a relationship of the form T = Adn where T is the period of oscillation, A is the constant of proportionality, d is the diameter of the ring, and n is a constant. Given this, and our desire to end up with a straight line on our graph, we consider the following:
if T = Adn, then log T = log A + n log d.
This equation should have a very familiar form to you - it is the equation for a straight line if you plot log T vs. log d, regardless of the value of n.
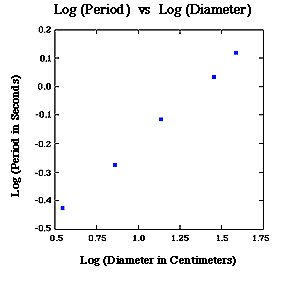
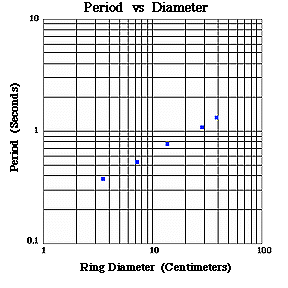
Now, plot the data in the following ways: (1) as log T versus log d on Cartesian graph paper; and (2) as T versus d on log-log graph paper. Compare the two plots and answer the following questions:
- What do you see?
- What are the values of A and n?
- How do these values compare with the equation for the period of
oscillation of a simple pendulum,

where g is the acceleration due to gravity, l is the length of the pendulum, and pi = 3.14?
- For a pendulum and a ring to have equal periods of oscillation, what
must be true?
- Given any set of measurements for T and d, what value for the
acceleration due to gravity here on Earth do you calculate?
 |
Show me a bigger version of this plot! |
 |
Show me a bigger version of this plot! |
Independent Activity
(pdf version available)
| X | 1 | 2 | 3 | 4 | 5 | 6 | 7 | 8 | 9 | 10 |
|---|---|---|---|---|---|---|---|---|---|---|
| Y | 4 | 32 | 108 | 256 | 500 | 864 | 1372 | 2048 | 2916 | 4000 |
Take me to the Stars and Slopes Main Page |
Take me to Day 2 |

