Lesson Plans: What's the Frequency, Roy G. Biv? Procedure

What's the Frequency, Roy G. Biv?
Lab Procedure
Team members: __________________________________
Date: ______
Class: _______________________
Summary
Today you are going to set up a lab to explore the relationship between wavelength and frequency of light.
- Triad decides who is:
- Data Keeper / Reader
- Materials Manager / Checker
- Time Keeper / Facilitator
- Materials Manager retrieves all materials listed from teacher. Reader should read all directions.
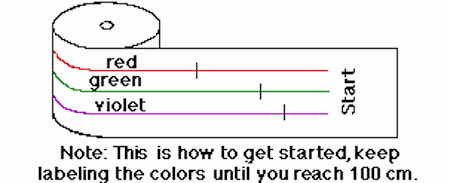
- Recorder should draw a vertical line about 20 cm from the beginning of the adding machine tape and label it "Start". With the metric ruler, make a point 100 cm from the starting point. Draw a vertical line and label it "End". Cut the tape off of the roll leaving about 20 cm space between "End" and where you cut.
- Next, Materials Manager draws three evenly spaced horizontal
lines using colored pencils to draw along the tape from Start to
End. Make the top line red, the middle line green and the bottom
line violet to represent three different colors in the spectrum of
light.
Note: The Time Keeper/ On Task Coordinator should continually keep everyone focused in order to complete this lab. He or she may also share in the completion of the tasks.
- Recorder divides the red line every 14 cm with dark marks in red
pencil. The green line should be divided every 10 cm and the violet
every 8 cm. The marks that you make on the three color lines will
represent the different wavelengths of the different colors of
light.
Note: The true wavelengths are actually measured in terms of angstroms. An angstrom is 10-8 cm or 0.00000001 cm. Red has a wavelength of 7800-6220 angstroms, green has a wavelength of 5770-4920 angstroms and violet has a wavelength of 4550-3900 angstroms. However, in this lab, the simple relationship among the visible light waves will be what is important.
- Materials Manager fastens the marked adding machine tape to a pencil using masking tape.
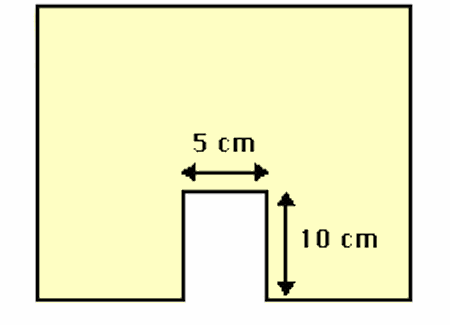
- Recorder cuts a manila folder along its crease. Then cuts a rectangle out of the center of one of the long sides. This rectangle should be about 10 cm high and 5 cm wide as shown below.
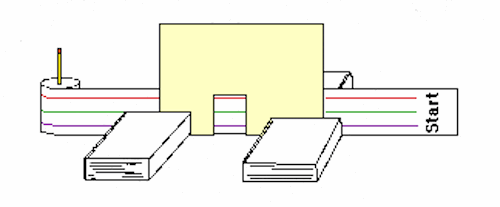
- Materials Manager sets the manila folder with the cut out on the table, supporting it with the four books as shown in the diagram below. Now s/he feeds the end of the adding machine tape through the narrow space between the manila folder and the two back books until "Start" appears in the middle of the opening in the manila folder.
- Recorder takes the Data Table and sits in front of the tape and manila folder model.
- Time Keeper calls "start" and begin timing as he or she slowly pulls the tape along. S/he should try to pull the tape at about the same speed for every trial!
- Recorder tallies in the appropriate box on the data table every time s/he sees a wavelength mark. When "End" appears, s/he tells the Time Keeper to stop timing.
- Each Triad makes one "trial run" and then repeats the procedure an additional 3 times.
- On the data table, Materials Manager determines and records the average number of wavelengths observed for each color and the average time (in seconds) from start to finish.
- Recorder determines and records the frequency for each of the colored light waves. Note: frequency is defined as the number of wavelengths passing a given point per second.

Diagram showing how to label the tape. (Credit: NASA's Imagine the Universe)

Diagram showing the cutout on the manila folder should look. (Credit: NASA's Imagine the Universe)

Diagram showing the setup for this lab. (Credit: NASA's Imagine the Universe)

