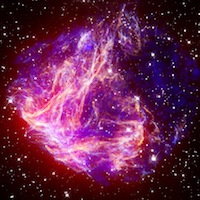
Supernova Chemistry Lesson Plan
Supernova Chemistry
Lab Procedure
Team Members: __________________________________
Date: ______
Class: _______________________
Summary
You are going to be observing the spectra of several different light sources and learning how this type of spectroscopy can be used to help astronomers tell what elements are out in the Universe.
Safety
This lesson gives the student an opportunity to identify elements by using spectroscopy and to relate this activity to astrophysics. Students will use spectrometers to measure the spectra of various light sources at 10 different lab stations.
Summary
Wear safety glasses throughout this activity. The devices used in this experiment to power the gas-filled tubes use a very high voltage of electricity.
Do not remove the gas-filled tubes or insert metal objects such as pens or paper clips into the power devices. The gas-filled tubes will be very hot to the touch, so be careful to not touch the surfaces.
Introduction
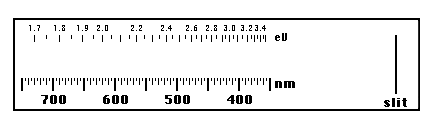
Atomic spectroscopy is an extremely important tool for scientists. Because the electron patterns around every kind of atom are unique, and because these electrons interact with light in different ways because of their different positions, you can determine what kinds of atoms are present in a substance by the kind of light absorbed or emitted by the substance. Every atom has a kind of "fingerprint" in the normal light spectrum that is measured with a device called a Spectrometer. This instrument uses a diffraction grating as a prism, splitting the incoming light into its composite colors.
As an example, a marine ecologist may suspect that the reason many bottom dwelling organisms are dying in a local harbor is because of a chemical pollutant. She samples the mud and chemically extracts a type of metal ion, but she’s not sure what kind of metal it is. She injects the metal ions into the hot flame of an atomic emission spectrometer and observes two line spectra. The lines correspond to the wavelengths of 563 nanometers (nm) and 615 nm. This combination is the "fingerprint" for tin. The ecologist may then trace the tin to a particular type of ship's paint or a nearby industrial source.
In this lab, your task is a bit easier than separating metal ions from sea mud. You are observing various light sources including tubes that have been filled with various types of gases. As electricity passes through these tubes, the gas glows and light is given off. You will compare the spectra of these gas tubes with incandescent (regular light bulb) sources and fluorescent light fixtures. Specifically, you will be asked to identify the gas that is used to fill fluorescent light tubes.
Procedure
Listen to your teacher's directions on how to use and care for the spectrometer. These instruments are expensive and fragile, so make certain that you understand the rules for their use.
Go through each observation station with your lab group. Use the spectrometer placed at each station to take your measurements. Everyone will start at different stations and move through the lab to complete their observations in the time established by your teacher. When observing the light from a gas tube, make sure that the center of the glowing spectrum tube is very close to and directly in front of the spectrometer slit.
CAUTION: Do not touch the gas tubes because they are hot and may give you an electrical shock!
-
Incandescent light bulb (white light)
Sketch what you see on the diagram below, marking the wavelengths that define each colored region. Also, mark the limits of your visual range on both ends of the spectrum. Sketch the range of colors observed using the colored pencils and note regions where the colors are most bright and most dim.
-
Hydrogen gas tube
Measure and draw the wavelength of any line spectra that appear on the blank spectrum on your data sheet. Sketch the range of any colors observed using the colored pencils and note regions where the colors are most bright and most dim.
-
Helium gas tube
Measure and draw the wavelength of any line spectra that appear on the blank spectrum on your data sheet. Sketch the range of any colors observed using the colored pencils and note regions where the colors are most bright and most dim.
-
Neon gas tube
Measure and draw the wavelength of any line spectra that appear on the blank spectrum on your data sheet. Sketch the range of any colors observed using the colored pencils and note regions where the colors are most bright and most dim.
-
Mercury gas tube
Measure and draw the wavelength of any line spectra that appear on the blank spectrum on your data sheet. Sketch the range of any colors observed using the colored pencils and note regions where the colors are most bright and most dim.
-
Nitrogen gas tube
Measure and draw the wavelength of any line spectra that appear on the blank spectrum on your data sheet. Sketch the range of any colors observed using the colored pencils and note regions where the colors are most bright and most dim.
-
"Plant Grow" light bulb
This is a bulb that is supposed to provide more light in the wavelengths that plants use than normal light bulbs. Sketch what you see, marking the wavelengths that define each colored region. Mark the limits of your visual range on both ends of the spectrum. Sketch the range of any colors observed using the colored pencils and note regions where the colors are most bright and most dim.
-
Compact Fluorescent light fixture
Measure and draw the wavelength of any line spectra that appear on the blank spectrum on your data sheet. Sketch the range of any colors observed using the colored pencils and note regions where the colors are most bright and most dim.
-
Chemical Light Sticks
These light sticks work by a chemical reaction which releases light energy instead of heat, sound, or electricity as other reactions may do. The reaction is very similar to the one that occurs in the tails of fireflies! On your data sheet, sketch what you see, marking the wavelengths that define each colored region. Also, mark the limits of your visual range on both ends of the spectrum. Sketch the range of any colors observed using the colored pencils and note regions where the colors are most bright and most dim.
-
Fluorescent light source
Turn your spectrometer slit toward a standard fluorescent light tube. This type of lighting is very common in schools and offices because it uses much less electricity than traditional incandescent light bulbs. Measure and draw the wavelength of any line spectra that appear on the blank spectrum on your data sheet. Sketch the range of any colors observed using the colored pencils, and note the regions where the colors are most bright and most dim.
