Lesson Plans: Time that Star! Student Worksheet
Time That Star!
Day 1 Wrap-up Worksheet
Name: _________________________________________
Date: ______
Class: _______________________
Today you examined the behavior of a simple pendulum. Fill out this worksheet with the results of your experiments. Each student is responsible for completing this worksheet.
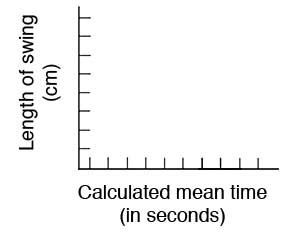
- Create a line plot of amplitude of each swing versus mean time it takes to make that swing on your own graph paper.
- Once you plot the data you have the "picture" of the period. What is your guess of the time for that period?
- How would the results be different if instead of a string 30 cm long, we used 10 cm string?
- How would the results be different we used a string 100 cm long?
- Summarize the relationship that you may see with time or swings and the use of different length string.
- This relationship is actually defined by certain laws of
physics. These laws let us say that the period is equal to:
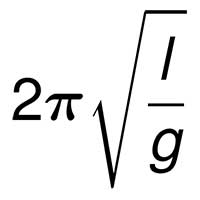
Where g is the acceleration due to gravity (here on Earth it has a value of 9.8 m/sec2.), L is the length of the pendulum string from where it is tied at the top to where the center of mass is of the tied object, and π = 3.14.
Does your guessed period in question 3 confirm this? Prove this by showing your work below.