Lesson Plans: Time that Star! (Day 2)
Time That Star!
Day 2 Sample of Epoch Folding
Summary
You are presented with a data sample set for the intensity of a signal over time. Can you determine if there is periodic behavior evident in the data? If so, what is the period? You'll use a technique called "Epoch Folding" to answer these questions
Procedure
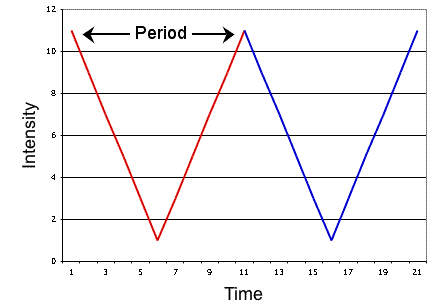
You are given the following data set for intensity (in increments of 100,000) over time (in months). Using the steps given below, you will find the true, mathematical period through a method called Epoch Folding.
| Time | 1 | 2 | 3 | 4 | 5 | 6 | 7 | 8 | 9 | 10 | 11 | 12 |
| Intensity | 11 | 9 | 7 | 5 | 3 | 1 | 3 | 5 | 7 | 9 | 11 | 9 |
| Time | 13 | 14 | 15 | 16 | 17 | 18 | 19 | 20 | 21 | 22 | 23 | 24 |
| Intensity | 7 | 5 | 3 | 1 | 3 | 5 | 7 | 9 | 11 | 9 | 7 | 5 |
- Create a line plot on graph paper.
- Guess the length of the period.
- Locate the section of the plot for your guess of a period, starting with the smallest time on the x-axis. Color over the line it makes with a red pencil.
- Locate the next period segment which should be an exact and adjacent match to the curve of the first period. Color over the line the second period makes with a blue pencil.
- Starting from the left end of the x-axis, find the 1st data
point on the red curve and the 1st data point on the blue curve and
determine the mean of their y values (in this case, intensity is the
y value). For this first data point, we will call its x-axis value
"Time Bin #1".
Continue to do this with the remaining points on the curves, calling the x-axis values "Time Bin #2", "Time Bin #3", etc. and associating the y value of mean with the x value "Time Bin".
- Create a chart that looks like this and import the appropriate, calculated data.
- Plot the data from that chart.
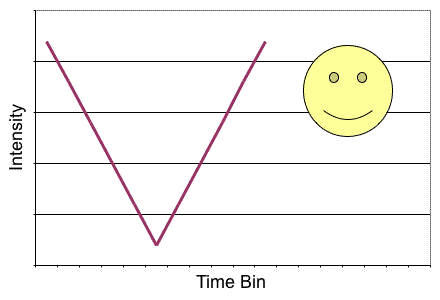
- Does it make a curve? Does it resemble the plot of your guessed period? If so, you have the period!
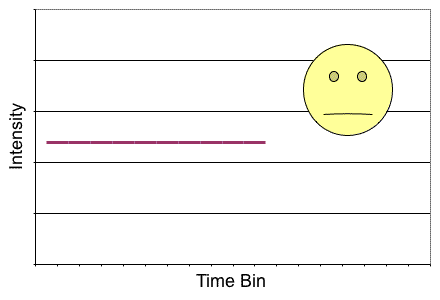
- Does it make a straight line, or an approximate straight line? If so, the period you guessed is wrong and you need to go back to step one of the Epoch Folding instructions and begin again.
- This method can be used with any periodic data set, though most data sets won't be as clean as this sample set!
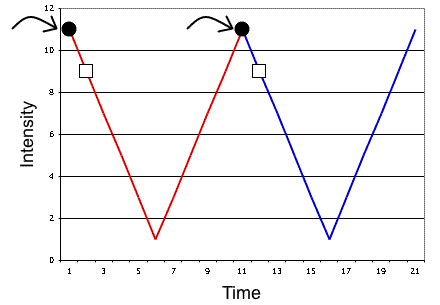
The two black dots represent the first locations on adjacent curves. The white squares represent the second two.
| Time Bin | Intensity |
|---|---|
| 1 | |
| 2 | |
| 3 | |
| 4 | |
| 5 | |
| 6 | |
| 7 | |
| 8 | |
| 9 | |
| etc. |