Lesson Plans: Time that Star! (Light curve information)
Time That Star!
Light Curves
A light curve is a graph which shows the brightness of an object over a period of time. In the study of objects which change their brightness over time such as novae, supernovae, and variable stars, the light curve is a simple, but valuable tool to a scientist.
When the students complete the 8 steps of Folding within their independent practice, they will actually be creating a light curve.
If the light curve you measured looked like this plot (see below), then you could identify your object as an eclipsing binary star. Notice that there are "dips" in the plot. This is happening because the stars are eclipsing each other. The larger "dips" occur when the smallest star is being totally eclipsed (smallest star is behind the largest star) and the smaller "dips" occur when the largest star is being totally eclipsed (largest star is behind the smallest star).
We can also tell from this light curve that it takes 10 days for one of the stars in the binary to orbit around the other one complete time. Astronomers would say this as "the orbital period of the binary system is 10 days". Even our Earth has an orbital period. We usually call it "one year" or "365.25 days".
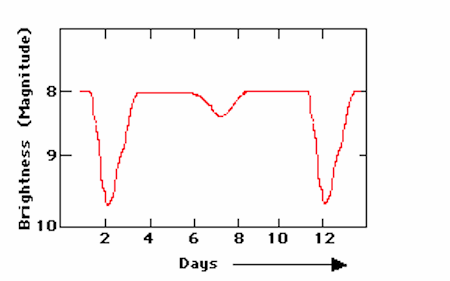
Sample light curve of an eclipsing binary star system.
