The Mystery of Cyg X-1
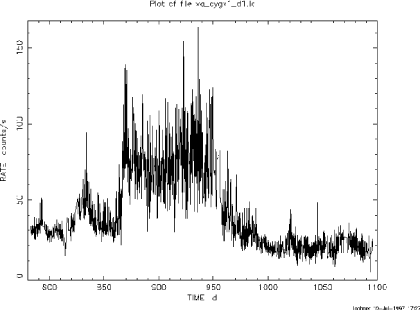
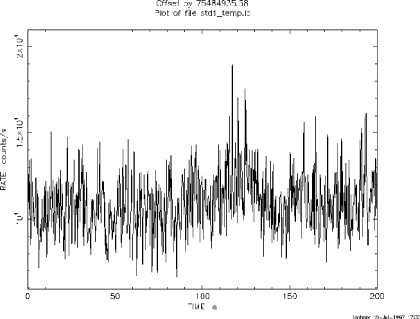
Cyg X-1 is an interesting source whether you look at it for only a few hundreds of seconds or a few hundreds of days. Unlike a light bulb which emits a pretty constant amount of radiation in a certain amount of time, Cyg X-1 is constantly fluctuating; emitting bursts of X-ray energy then flickering and sputtering, all in an apparently random manner. In short time scales, the fluctuations are smaller and over long time scales the fluctuations are larger. In some events, Cyg X-1's X-ray output doubles over a period of less than a week, remaining at a high average for months before settling down to a more normal, lower average. This rare kind of outburst was actually caught by XTE!! (which the scientists were especially excited about because it gave them a great chance to study the phenomenon!).
For a long time scientists thought that this kind of variation on all scales was unique to black holes, but that has since been disproved.
The plots below illustrate the X-ray variability of Cyg X-1 on both short (a) and long (b) timescales. This data, which were taken by the XTE satellite, is extremely robust, and the error bars are very small. They are so small, in fact, that putting them into the plot makes it virtually unreadable. What is most important about this fact is that since the error bars on the data are small, we know that the observed variations are real. They are not generated by noise in the instruments, in other words. (Image courtesy of Dr. Jim Lochner.

XTE data showing variability of Cyg X-1 from 780 to 1100 days

XTE data showing variability of Cyg X-1 from 0 to 200 seconds


