

What Is a Spectrum and What Do They Tell Us?
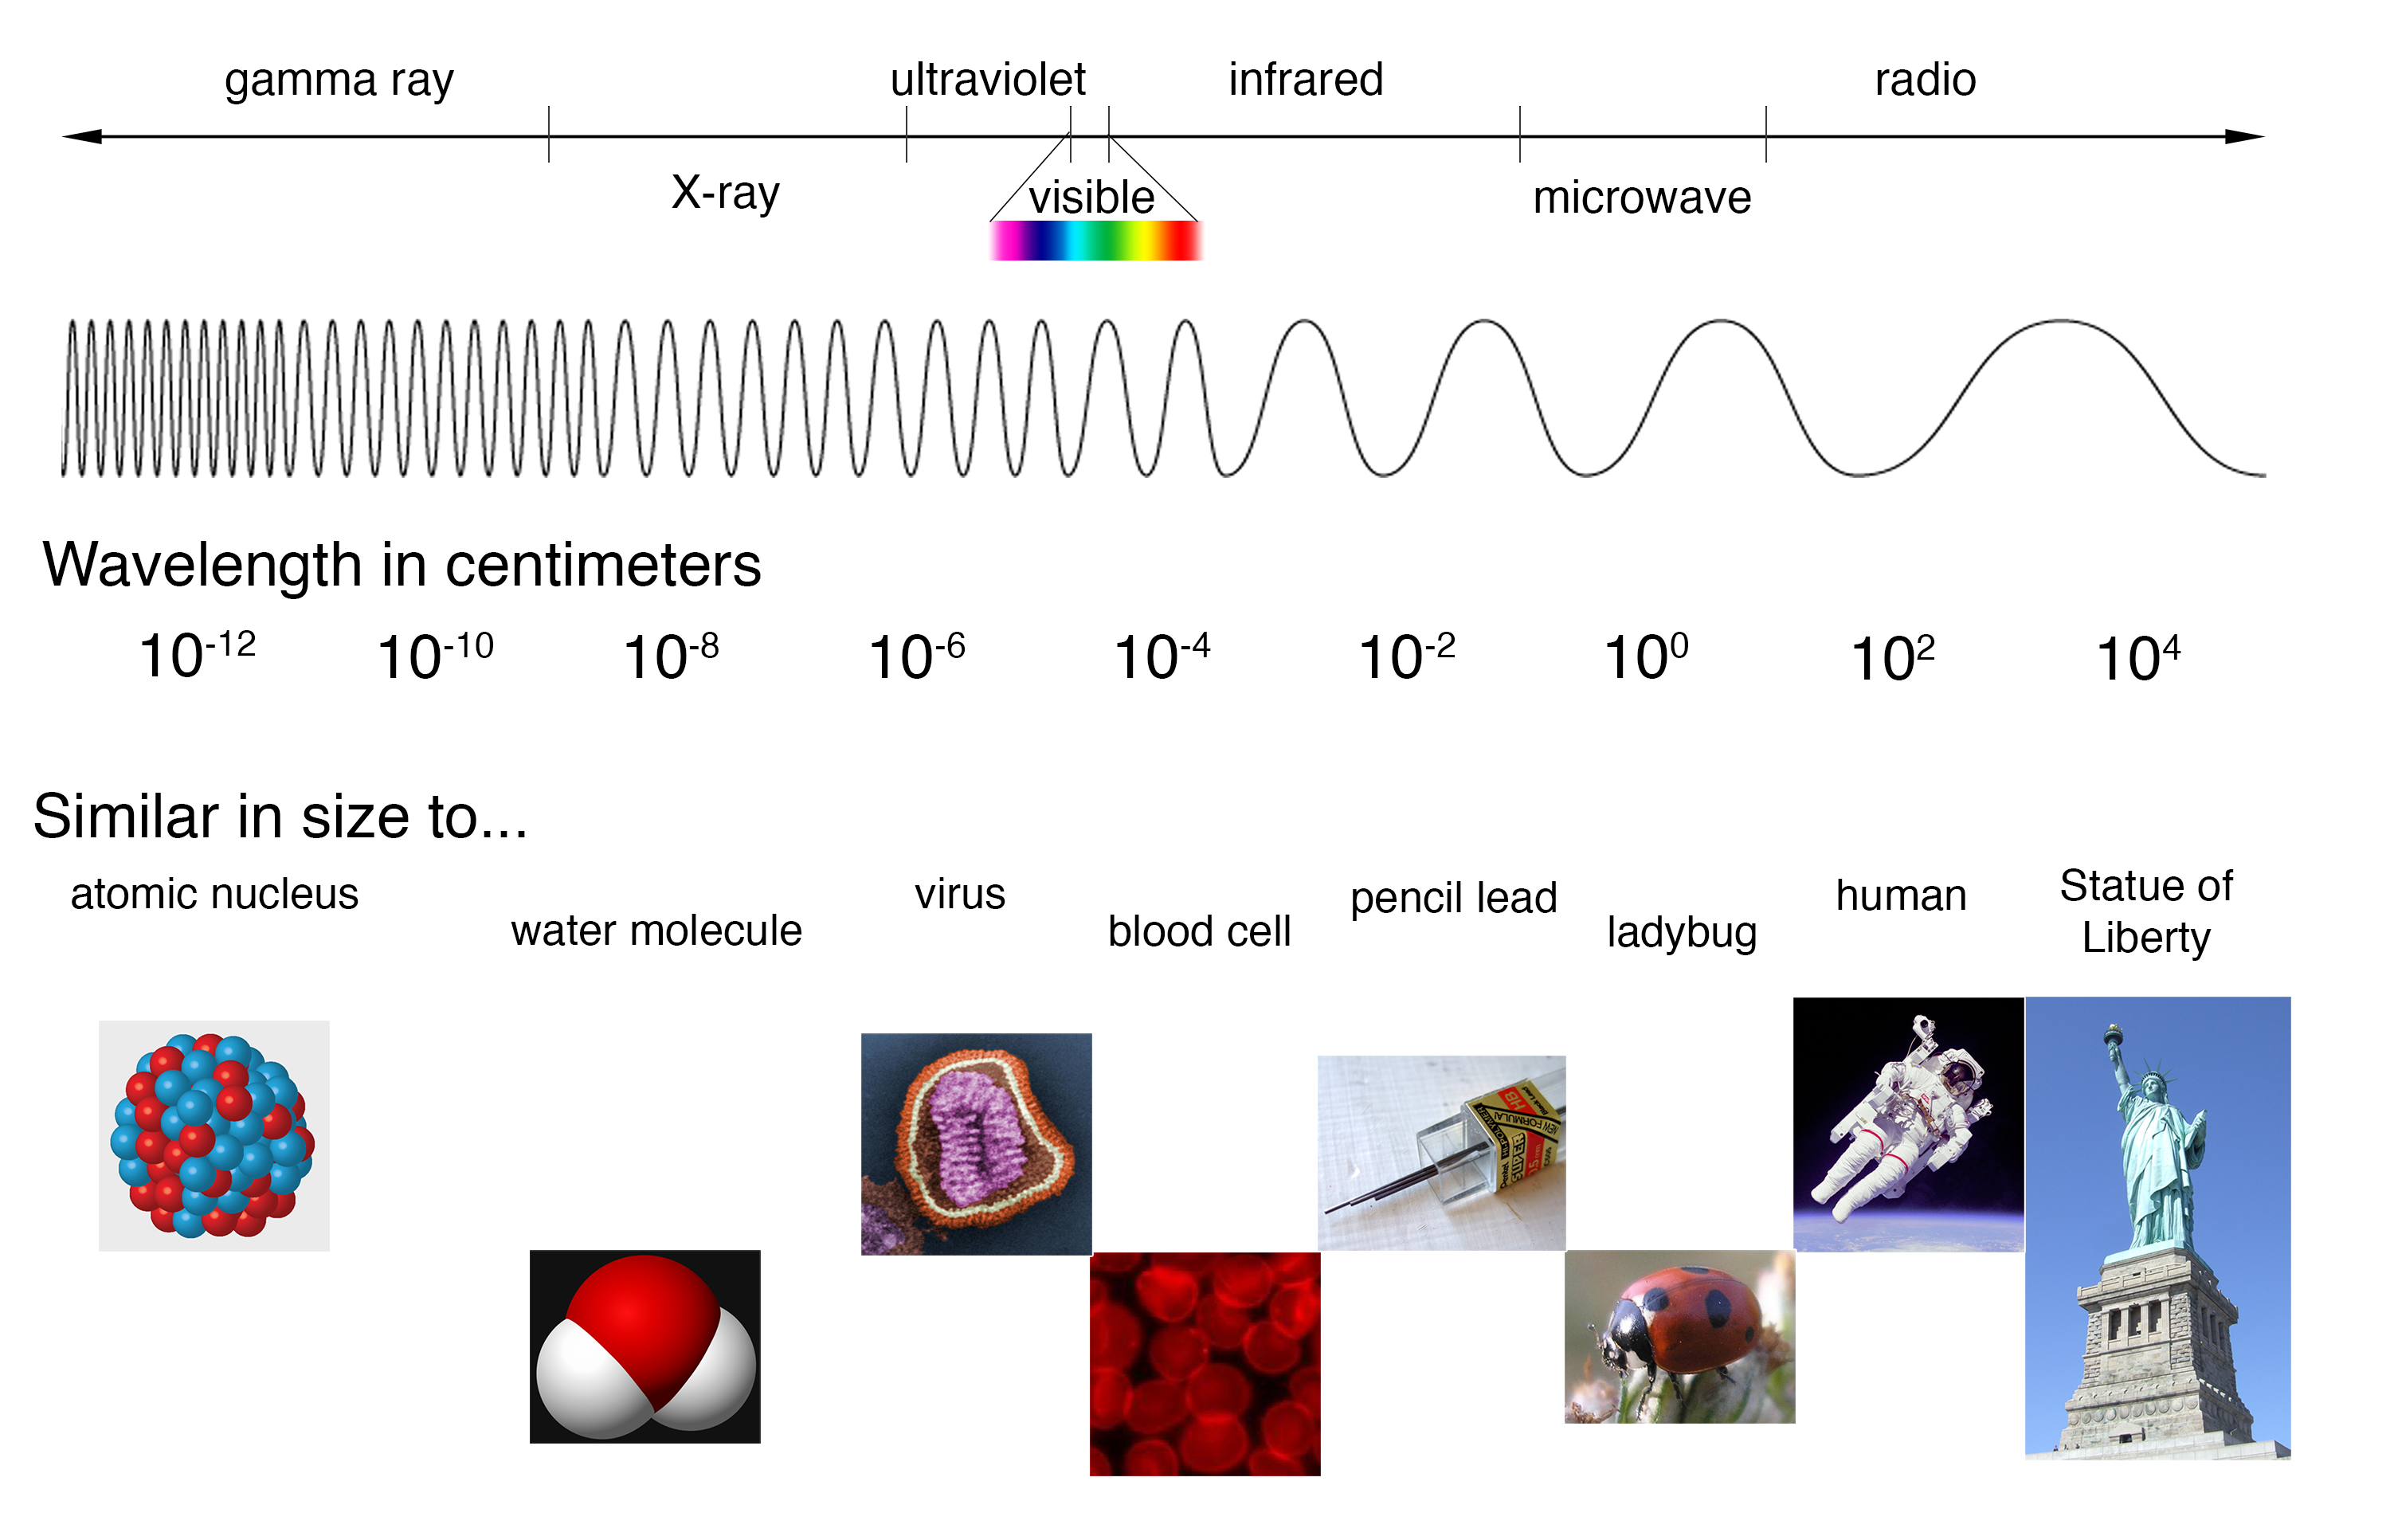
If you let the light from the Sun pass through a prism, the result is a wonderful display of all the colors of the rainbow. Separating the combined colors of the Sun like this gives you a "spectrum", which is just a measure of light emission as a function of energy (or wavelength, or frequency, which are all related). Such a spectrum from the Sun is known as the "visible spectrum", but it is just a small part of the light in the electromagnetic spectrum, which spans energies from radio waves to gamma-rays.
(Credit: NASA's Imagine the Universe)
The spectrum of the Sun appears as a continuous spectrum and is frequently represented as shown below. This type of spectrum is called an emission spectrum because what you are seeing is the direct radiation emitted by the source. In the case of the Sun, light is emitted at almost all energies in the visible spectrum, which is why you see all of the colors in the Sun's spectrum.

Consider another spectrum as shown below:

Clearly, this is not a continuous spectrum; however, it still represents visible radiation that has been separated into its constituent colors. In the image above, the horizontal axis shows the energy (or color) of the light, the same as the spectrum above, the light is emitted only at particular "discrete" energies corresponding to the bright lines. It turns out that each chemical element emits its own characteristic pattern. The one shown above is characteristic of carbon. These type of spectra can be generated for many elements by vaporizing the element in a flame.
We can learn a lot from those spectral lines. Two very important things we can learn from spectral lines is the chemical composition of objects in space and their motions.
Chemical Composition
During the first half of the 19th century, scientists such as John Herschel, Fox Talbot, and William Swan studied the spectra of different chemical elements in flames. Since then, the idea that each element produces a set of characteristic emission lines has become well-established. Each element has several prominent, and many lesser, emission lines in a characteristic pattern.
Sodium, for example, has two prominent yellow lines (the so-called D lines) at 589.0 and 589.6 nm – any sample that contains sodium (such as table salt) can be easily recognized using these pair of lines.
The studies of the Sun's spectrum revealed absorption lines, rather than emission lines (dark lines against the brighter continuum). The precise origin of these 'Fraunhofer lines' as we call them today remained in doubt for many years, until Gustav Kirchhoff, in 1859, announced that the same substance can either produce emission lines (when a hot gas is emitting its own light) or absorption lines (when a light from a brighter, and usually hotter, source is shone through it). With that discovery, scientists had the means to determine the chemical composition of stars through spectroscopy.
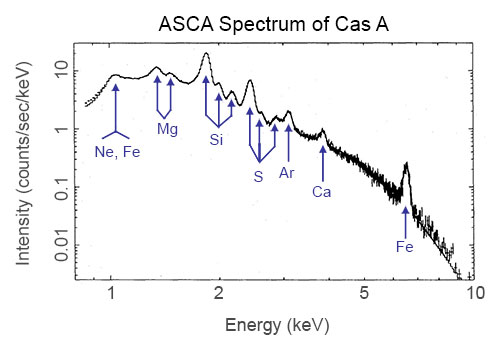
Stars aren't the only objects for which we can identify chemical elements. Any spectrum from any object allows us to look for the signatures of elements. This includes nebula, supernova remnants and galaxies.
Motions of stars and galaxies
Once we have identified specific elements in a spectrum, we can also look to see if the emission lines from those elements has been shifted from where we might expect to find them. While we usually talk about emission spectra as though the wavelengths of the lines are fixed, that is only true when the source emitting the lines and the detector "seeing" the lines are not moving relative to one another. When they are moving relative to each other, the lines will appear shifted. For example, if a star is moving toward us, its lines will be observed at shorter wavelengths, which is called "blueshifted". If the star is moving away from us, the lines will appear at longer wavelengths, which is called "redshifted". This phenomenon is called "Doppler shift."
If the spectrum of a star is red or blue shifted, then you can use that to infer their velocities along the line of sight.
 Return to finding the orbit and period of the black hole's companion