

More On Spectra and Their Representations
If you let the light from the Sun pass through a prism, the result is a wonderful display of all the colors of the rainbow. Separating the combined colors of the Sun like this gives you a "spectrum", which is just a measure of light emission as a function of energy (or wavelength, or frequency, which are all related). Such a spectrum from the Sun is known as the "visible spectrum", but it is just a small part of the light in the electromagnetic spectrum, which spans energies from radio waves to gamma-rays.
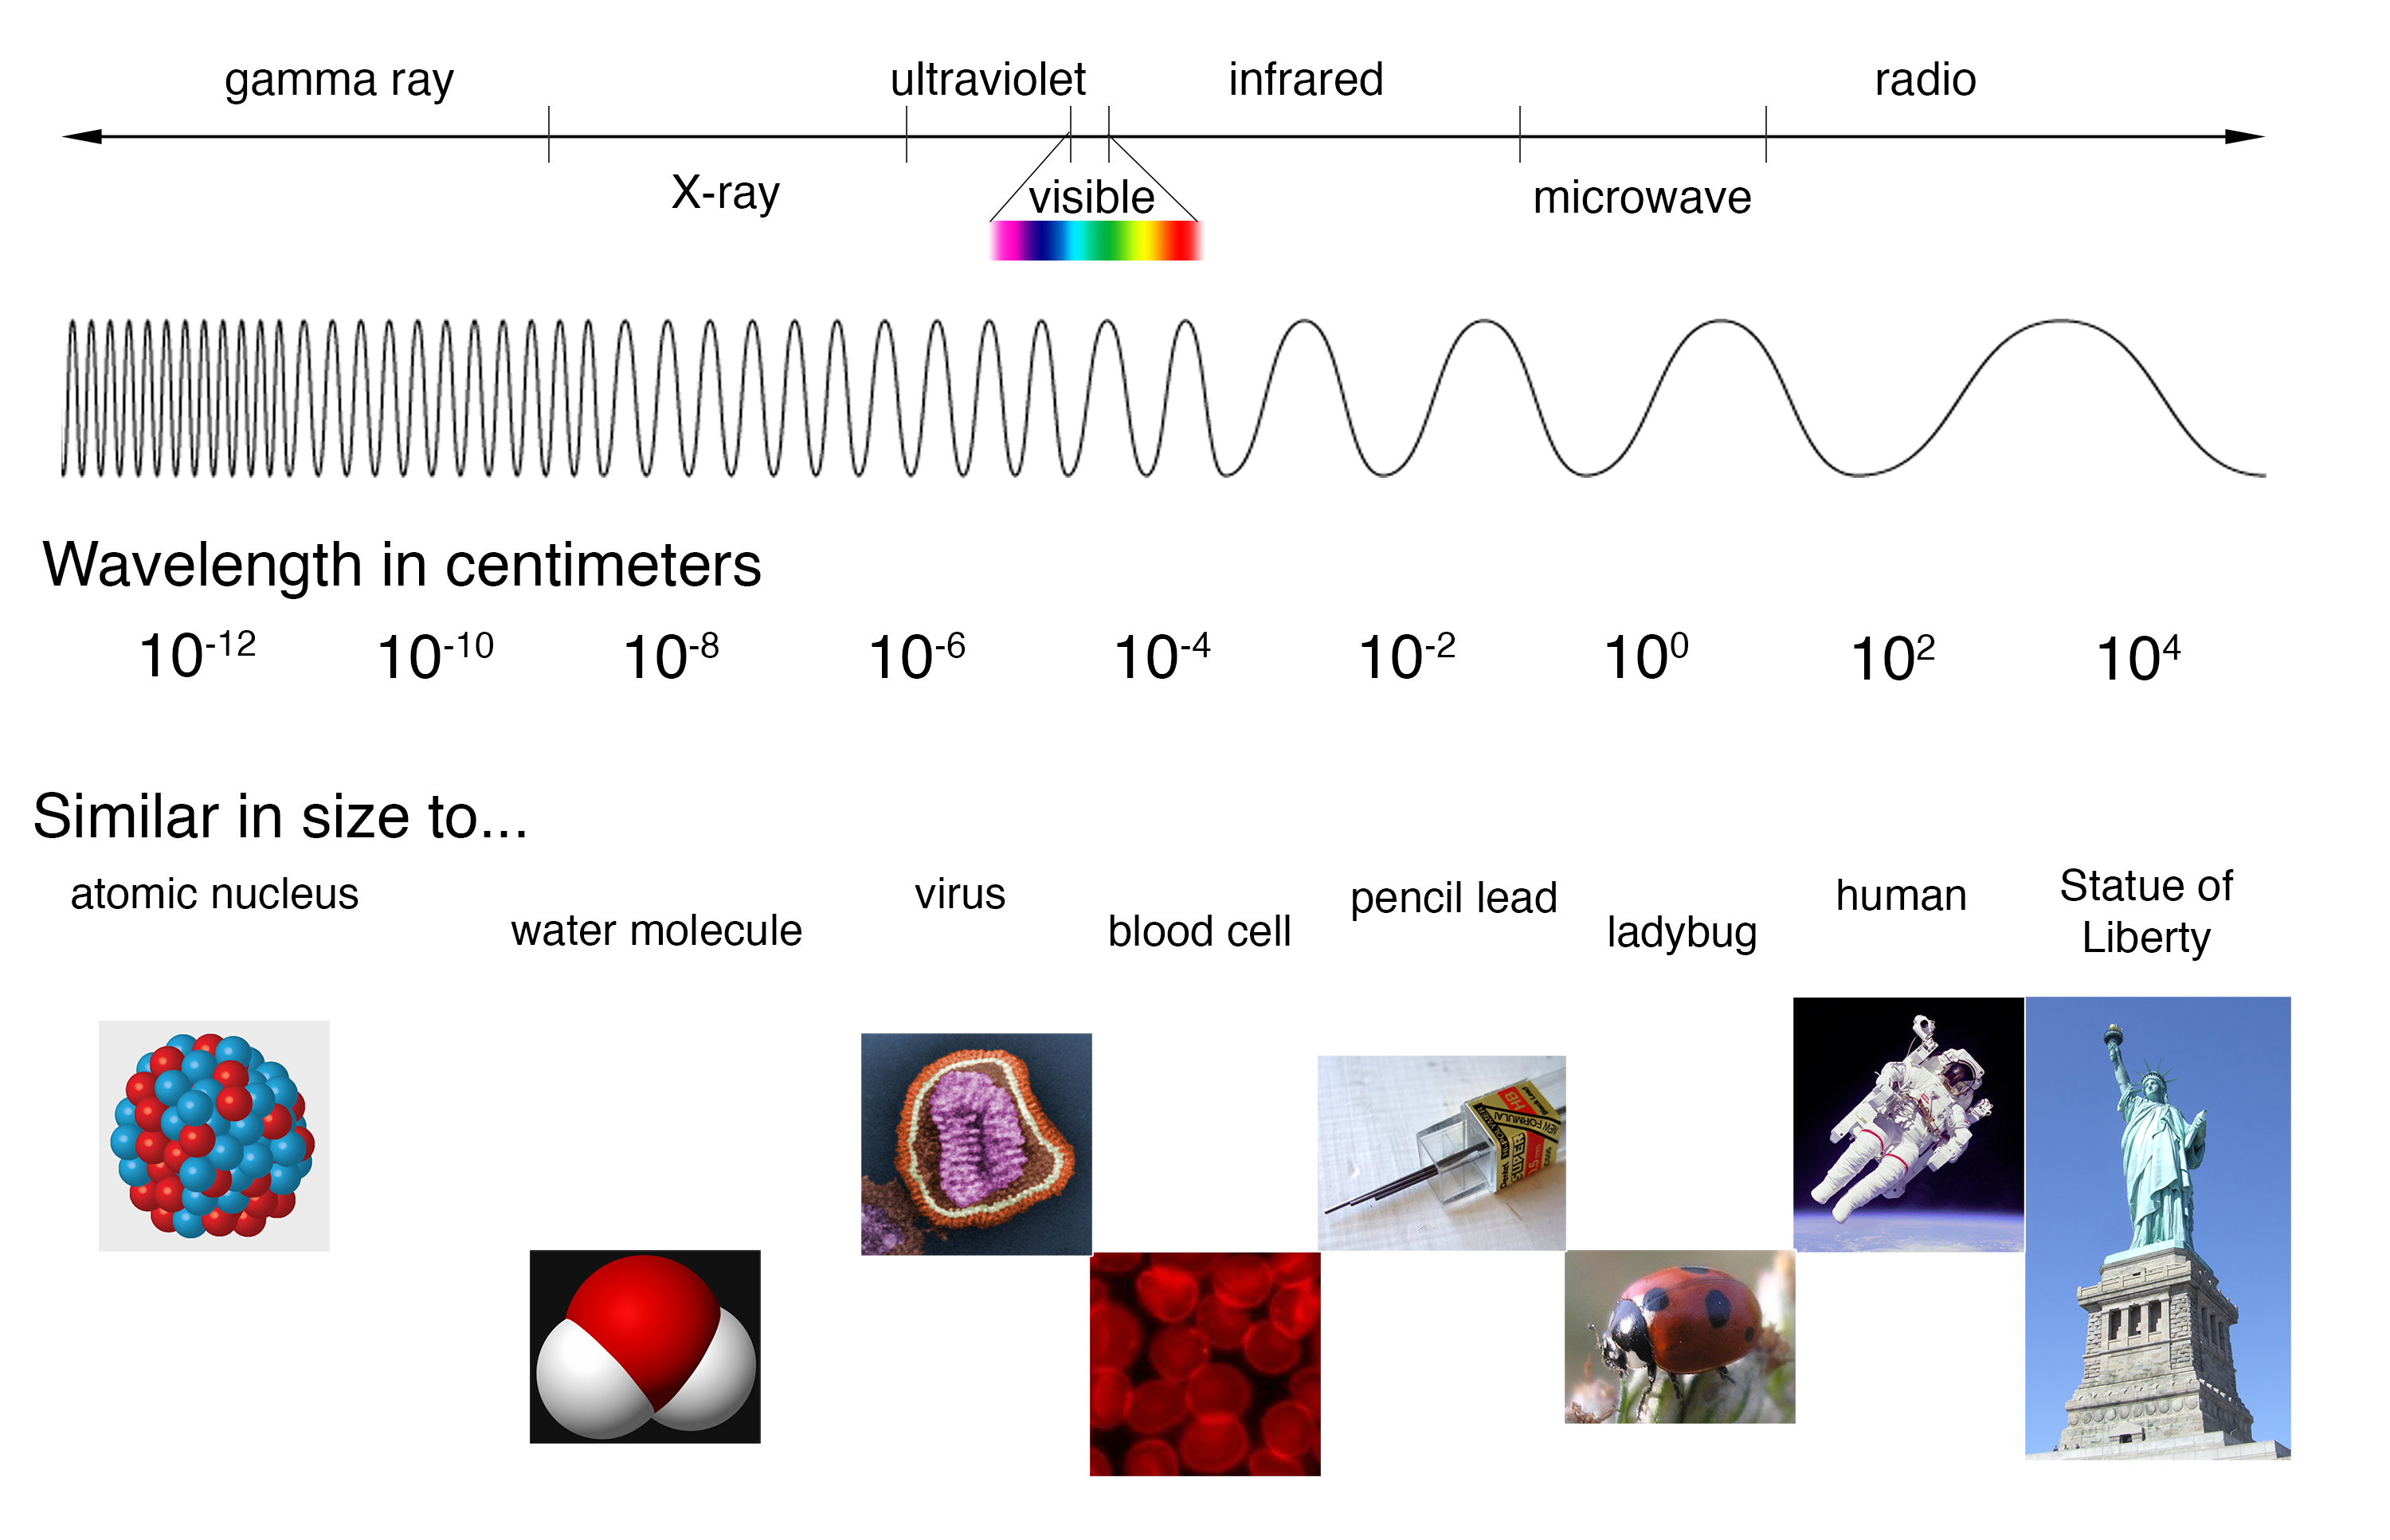
(Credit: NASA's Imagine the Universe)
The spectrum of the Sun appears as a continuous spectrum and is frequently represented as shown below. This type of spectrum is called an emission spectrum because what you are seeing is the direct radiation emitted by the source. In the case of the Sun, light is emitted at almost all energies in the visible spectrum, which is why you see all of the colors in the Sun's spectrum.

Consider another spectrum as shown below:

Clearly, this is not a continuous spectrum; however, it still represents visible radiation that has been separated into its constituent colors. In the image above, the horizontal axis shows the energy (or color) of the light, the same as the spectrum above, the light is emitted only at particular "discrete" energies corresponding to the bright lines. It turns out that each chemical element emits its own characteristic pattern. The one shown above characteristic of carbon. These type of spectra can be generated for many elements by vaporizing the element in a flame.
Representations of Spectra
While the colors in the above representations of spectra are pretty, their usefulness is limited. We can't really see how much light there is of each of the colors – they seem about equally bright, and it would be hard to make a quantitative comparison. On top of that, they would convey no information at all if it the observed radiation was outside the limits of the human eye.
Scientists, then, tend to use a different representation which permits a more rigorous analysis. Consider the spectrum as shown below.
The top spectrum shows a narrow segment of Sun's spectrum of ultraviolet (UV) light. This representation has been modeled after the visible spectra. Remember that our eyes can't see ultraviolet light; however, as with the visible spectra shown above, the horizontal axis (the x-axis) shows the energy (or "color") of the observed light. The spectrum covers wavelengths of energy between 300 and 350 angstroms. In that representation, we can see where the emission by the Sun is most active, but again we see little about the intensity of the radiation. There is no quantitative measure of the light emitted as a function of energy.
The graph below the Sun's UV spectrum shows the same information in a more quantitative format. As with the other spectra, the x-axis indicates the energy of the observed light. However, instead of indicating the observed energies with light bands, the graph shows the intensity of the radiation on the y-axis.
While the graph isn't as colorful as those shown in a "photographic" format, this representation tells us much about the UV emission of the Sun. Compare the two representations of the solar UV spectrum. Notice that where the first spectrum shows a bright line, the second shows a peak in the graph. This type of spectrum shows us not only where the Sun emits light, but also gives a measure of how much light is emitted as a function of energy.
Absorption Spectra
The above examples have been of emission spectra; however, there is another type called "absorption spectra." Sometimes when we view sunlight through a gas, we get a spectrum which is continuous except for the regions in which the gaseous element would have emitted its signature spectra if heated. Essentially, the spectrum that we observe is the continuous spectrum with dark spots where the gas has "picked out" the continuum.

(Credit: NASA's Imagine the Universe)
The spectrum above shows a continuum spectrum absorbed by an gas. The dark bands correspond the exact wavelengths of lights we would see in an emission spectrum, and can similarly be used to identify the characteristic spectrum of various elements.
Here is another example of an absorption spectrum. This one is presented on many different lines because if we laid this out a a single line it would stretch across the width of your browser many, many times. The incredible detail in this spectrum is due to the high resolution of the detector used to record it.
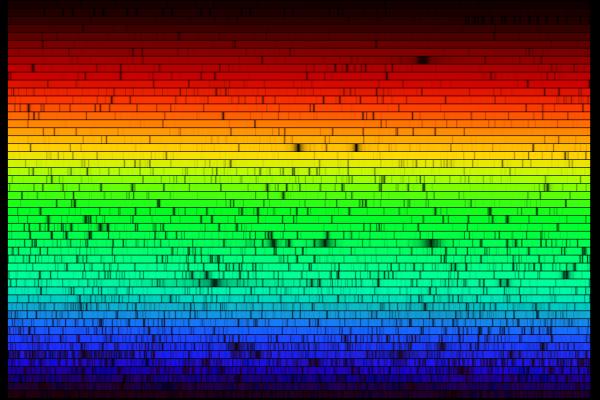
(Credit: N.A.Sharp, NOAO/NSO/Kitt Peak FTS/AURA/NSF)
When the light leaves the surface of the Sun, it is very nearly a continuous spectrum. However, as it passes through the Sun's atmosphere, gasses present in that atmosphere absorb specific wavelengths of light, leaving the pattern seen in the spectrum above. By studying those lines and matching them to known lines from elements, astronomers are able to determine what gasses are present in the Sun's atmosphere.
 Quiz your knowledge of the spectral representations

