

Data Analysis
Once you have data from a satellite in your hands in a useful format, you will want to scrutinize that data in as many ways available. By using different tools, you can reveal information about how the source behaves over time, at various energy ranges and at different points in space. The following are tools that you would use to understand your new data.
Light Curves
The light curve of the x-ray binary system GX301-2, obtained by the All Sky Monitor aboard the Rossi X-ray Timing Explorer. The regular increase and decrease in intensity follows the motion of the neutron star around a massive normal star companion once every 41.5 days.
A light curve is a graph of an object's brightness over a period of time. Some types of sources have distinctive light curves, so you might be able to tell what your source is just by looking at the light curve. As an example, the light curve of an eclipsing binary system will display two "dips," each occurring when one of the stars "eclipses" the other.
Light curves also reveal how a source's brightness changes over time, which can constrain some of the source's properties. If the source is changing in a cyclic manner, the change is likely to be either from the rotation the source itself or from an orbiting object. This is because rotations and orbits repeat with definite periods. The period over which the light curve repeats puts limits on the source's mass and size.
Tell me more about Light Curves and What They Can Tell Us.
Spectra
A spectrum of the cataclysmic variable system BY Cam, taken by the Broad Band X-ray Telescope.
A spectrum is a plot of a source's intensity at different energies (or, equivalently, wavelengths or frequencies). By looking at spectra, you can determine which elements (like hydrogen, helium, etc.) are present either in the source or between Earth and the source. This can be done because each element emits and absorbs light at very specific energies. Therefore, the energies where spikes or dips appear in a spectrum reveal which elements are present.
Those spikes and dips in the spectrum, called spectral lines, hold information other than just what element emitted them. They can tell you information about magnetic field of the source, how fast the material was moving when it emitted its light, and whether the source is orbiting another object.
Tell me more about Spectra and What Scientists Can Learn From Them.
Images
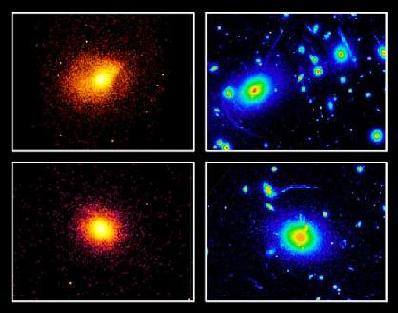
X-ray (left-hand panels) and optical (right-hand panels) images of the galaxy clusters Abell 2390 (top) and MS2137.3-2353. While the optical image shows the galaxies, the x-ray image shows a multi-million degree gas which lies between the galaxies. (For further details, see Astronomy Picture of the Day for 24 October 2001. (Credit: S. Allen (IoA Cambridge) et al., NASA)
An image is a representation of the brightness of an object in the spatial domain. That photograph of your Aunt Martha is an image; however, it is an image in optical light. Astronomers observe sources in many other kinds of light, so when an astronomer makes an image from X-ray data, the images are not what you or I would see if we looked at the source with our eyes. Instead the image is what the source would look like if we could see X-rays.
By looking at an image of an object, you can tell where the X-rays are being generated. Astronomers knew that clusters of galaxies were sources of huge numbers of X-rays. One theory about where in the cluster the X-rays were generated said that the X-rays came from the galaxies themselves. However, this would have required extraordinary X-ray emission either from either each galaxy or from a handful of galaxies. A second theory was that the emission came from hot gas between the galaxies in the clusters. Based on physical arguments, astronomers started to converge on the second theory. However, we can now produce images with high enough resolution to see the emission from hot gas, and it does come from between the galaxies.
Tell me more about Images.