

Science Illustration Gallery
These images all illustrate some aspect of Fermi science.
Each image can be clicked for a larger version. Please note NASA's Image Use Guidelines.
All-sky Maps
All-sky map from Fermi's "first light"; this map combines 95 hours of the LAT instrument's "first light" observations.
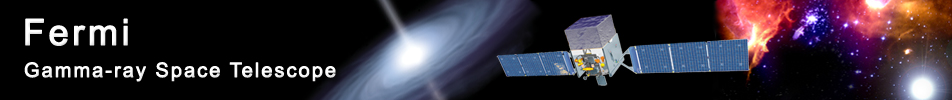
All-sky map constructed from one year of Fermi LAT observations. The map shows the rate at which the LAT detects gamma rays with energies above 300 million electron volts - about 120 million times the energy of visible light - from different sky directions. Brighter colors equal higher rates. (Credit: NASA/DOE/Fermi LAT Collaboration)
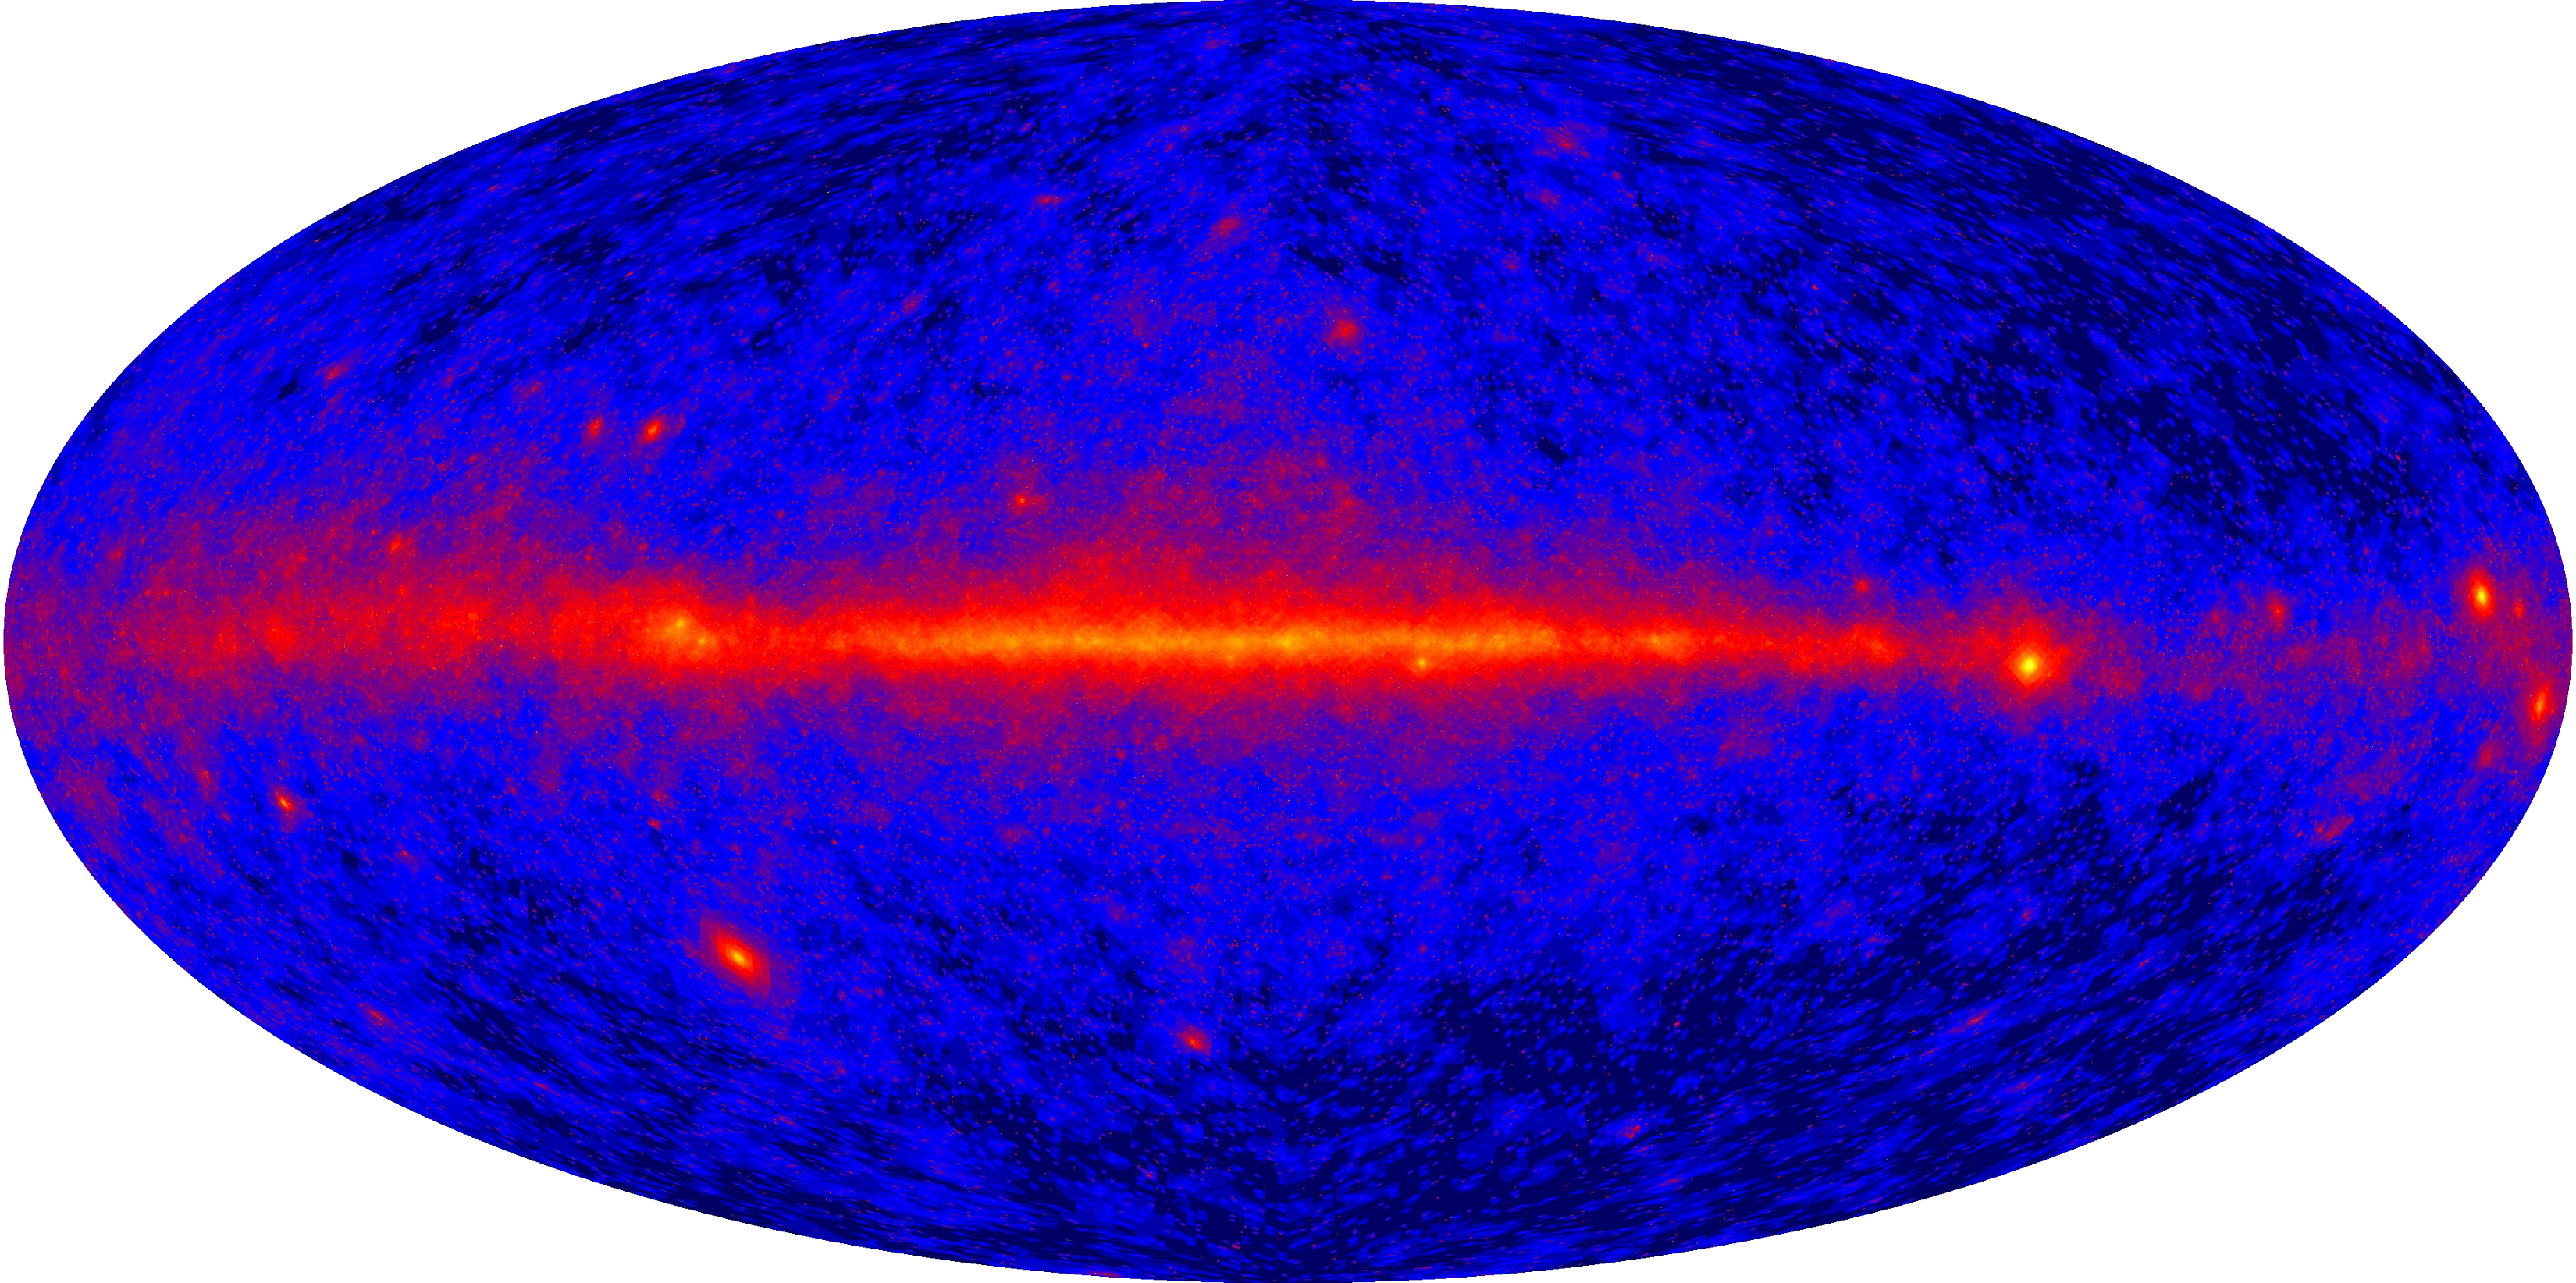
All-sky map constructed from two years of observations by NASA's Fermi Gamma-ray Space Telescope. The view shows how the sky appears at energies greater than 1 billion electron volts (1 GeV). (Credit: NASA/DOE/Fermi LAT Collaboration)
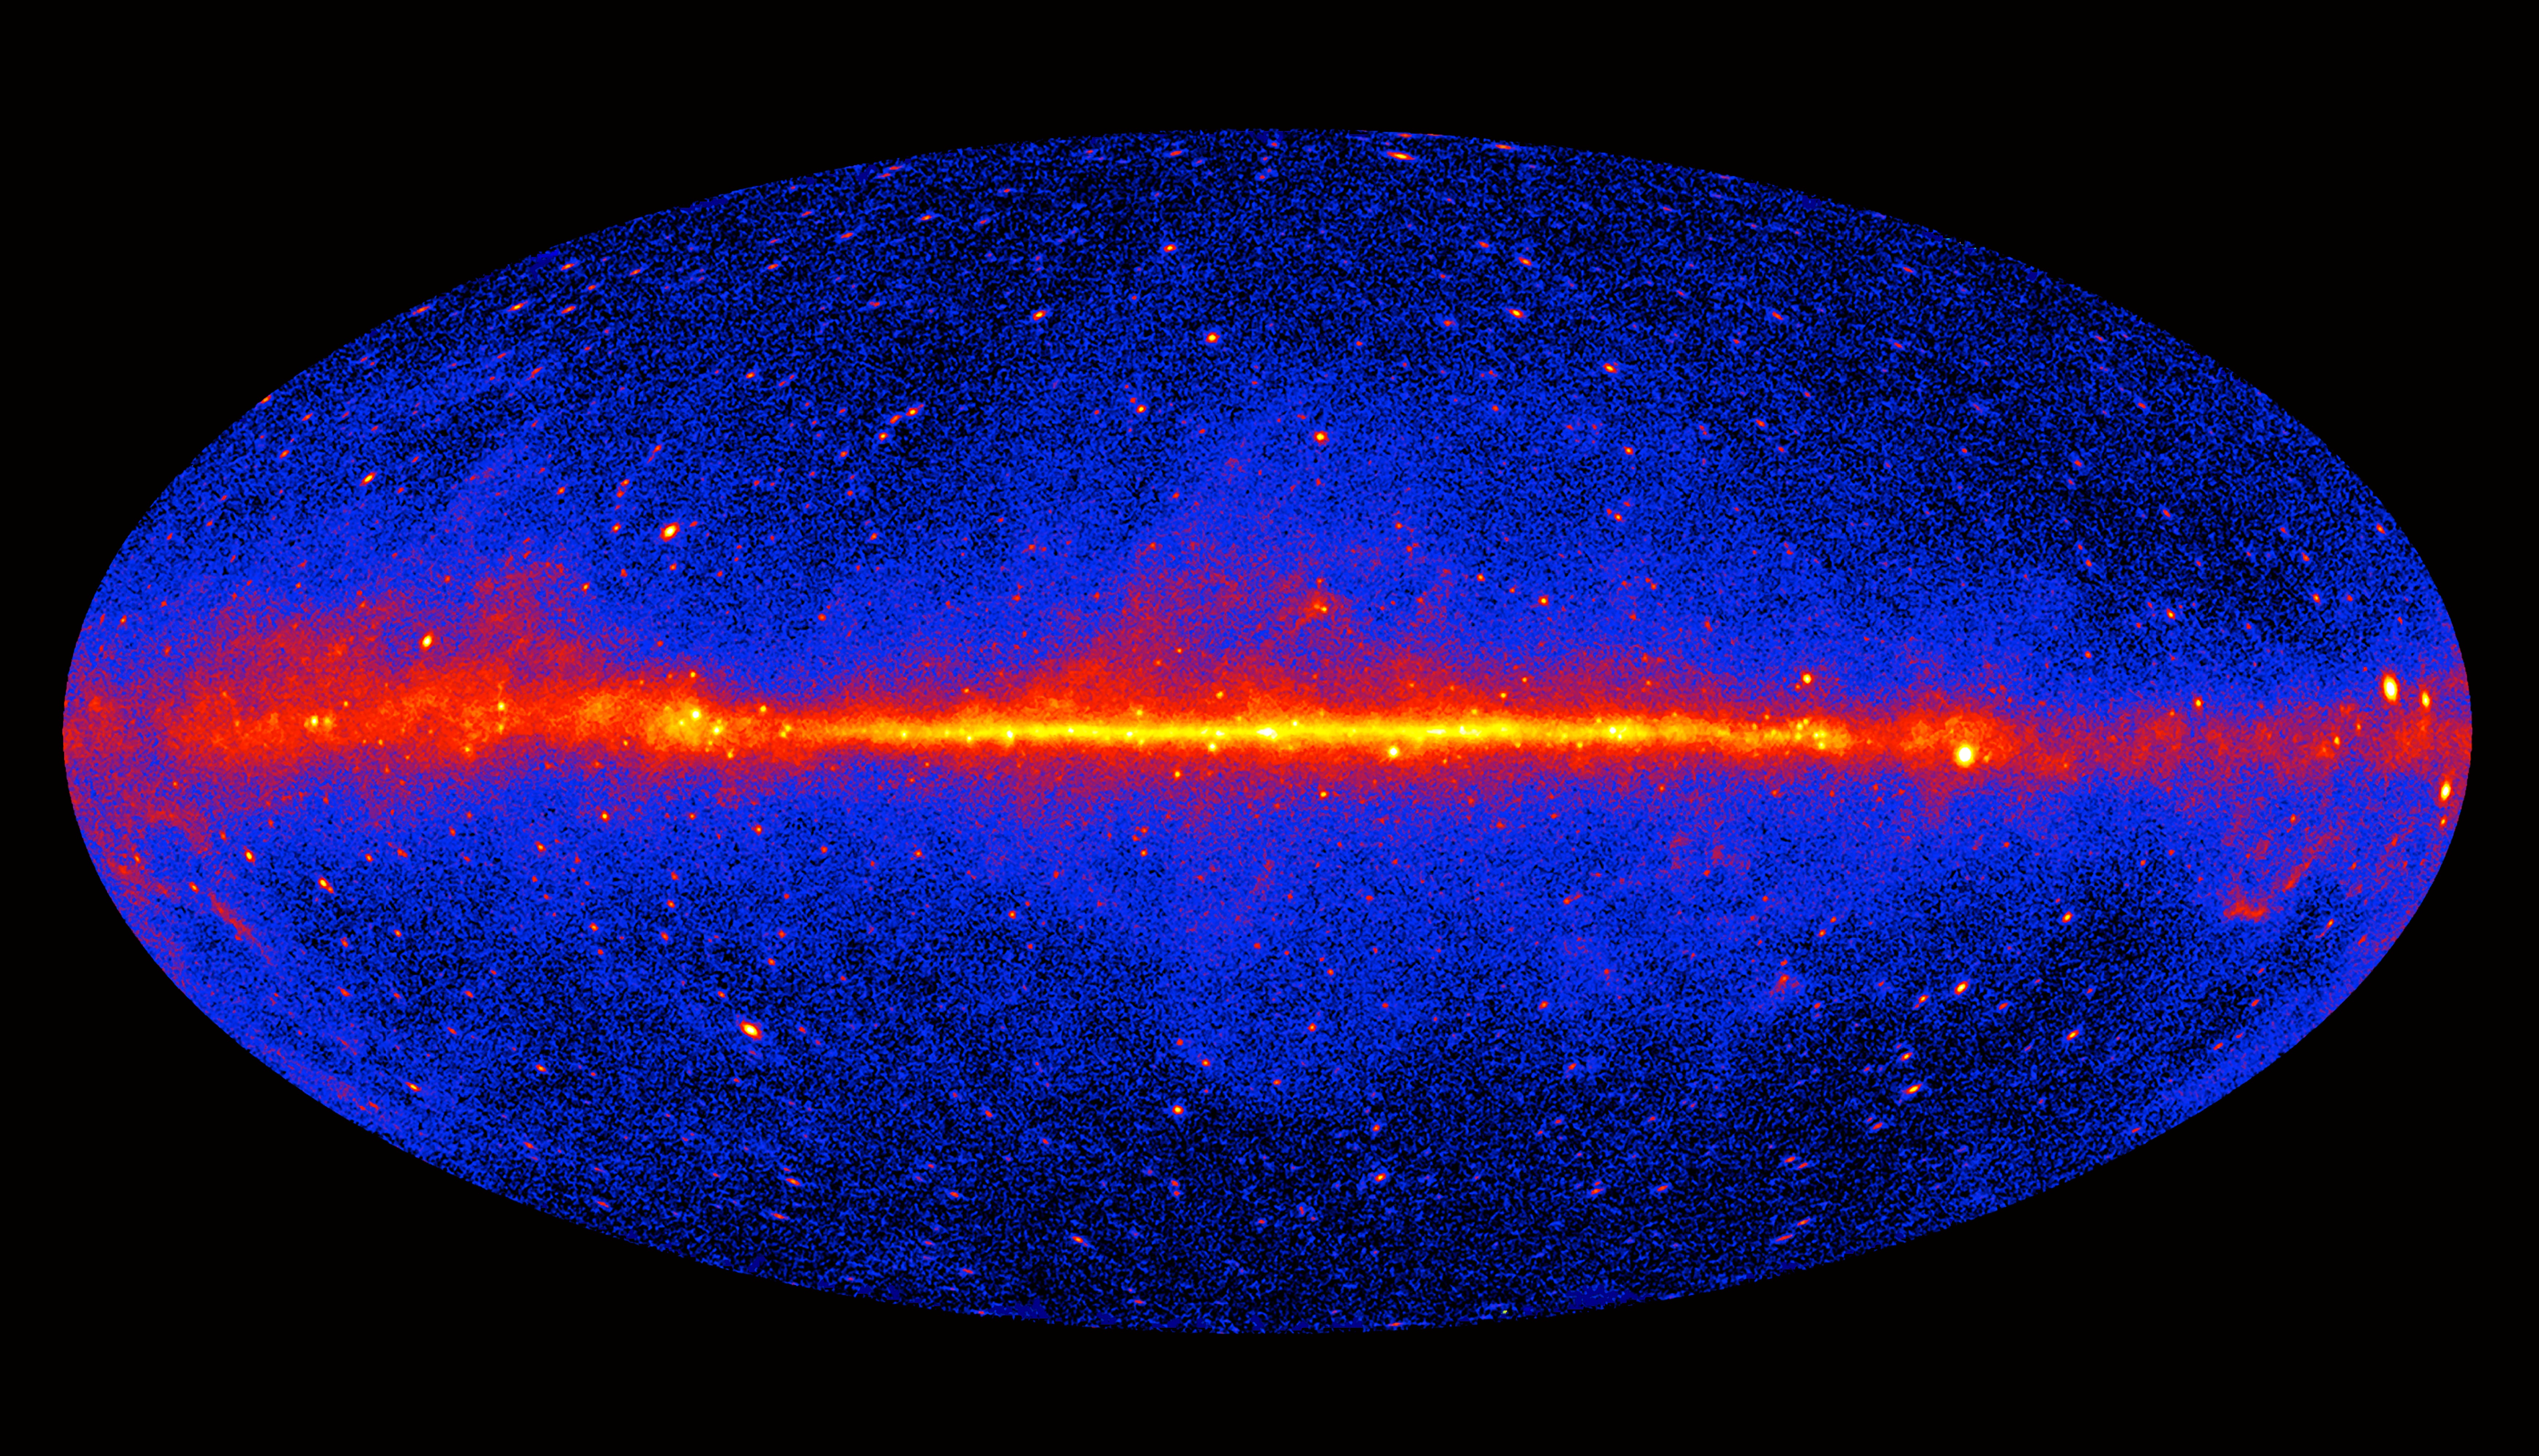
This image of the entire sky includes three years of observations by Fermi's Large Area Telescope (LAT). It shows how the sky appears at energies greater than 1 billion electron volts (1 GeV). Brighter colors indicate brighter gamma-ray sources. (Credit: NASA/DOE/Fermi LAT Collaboration)
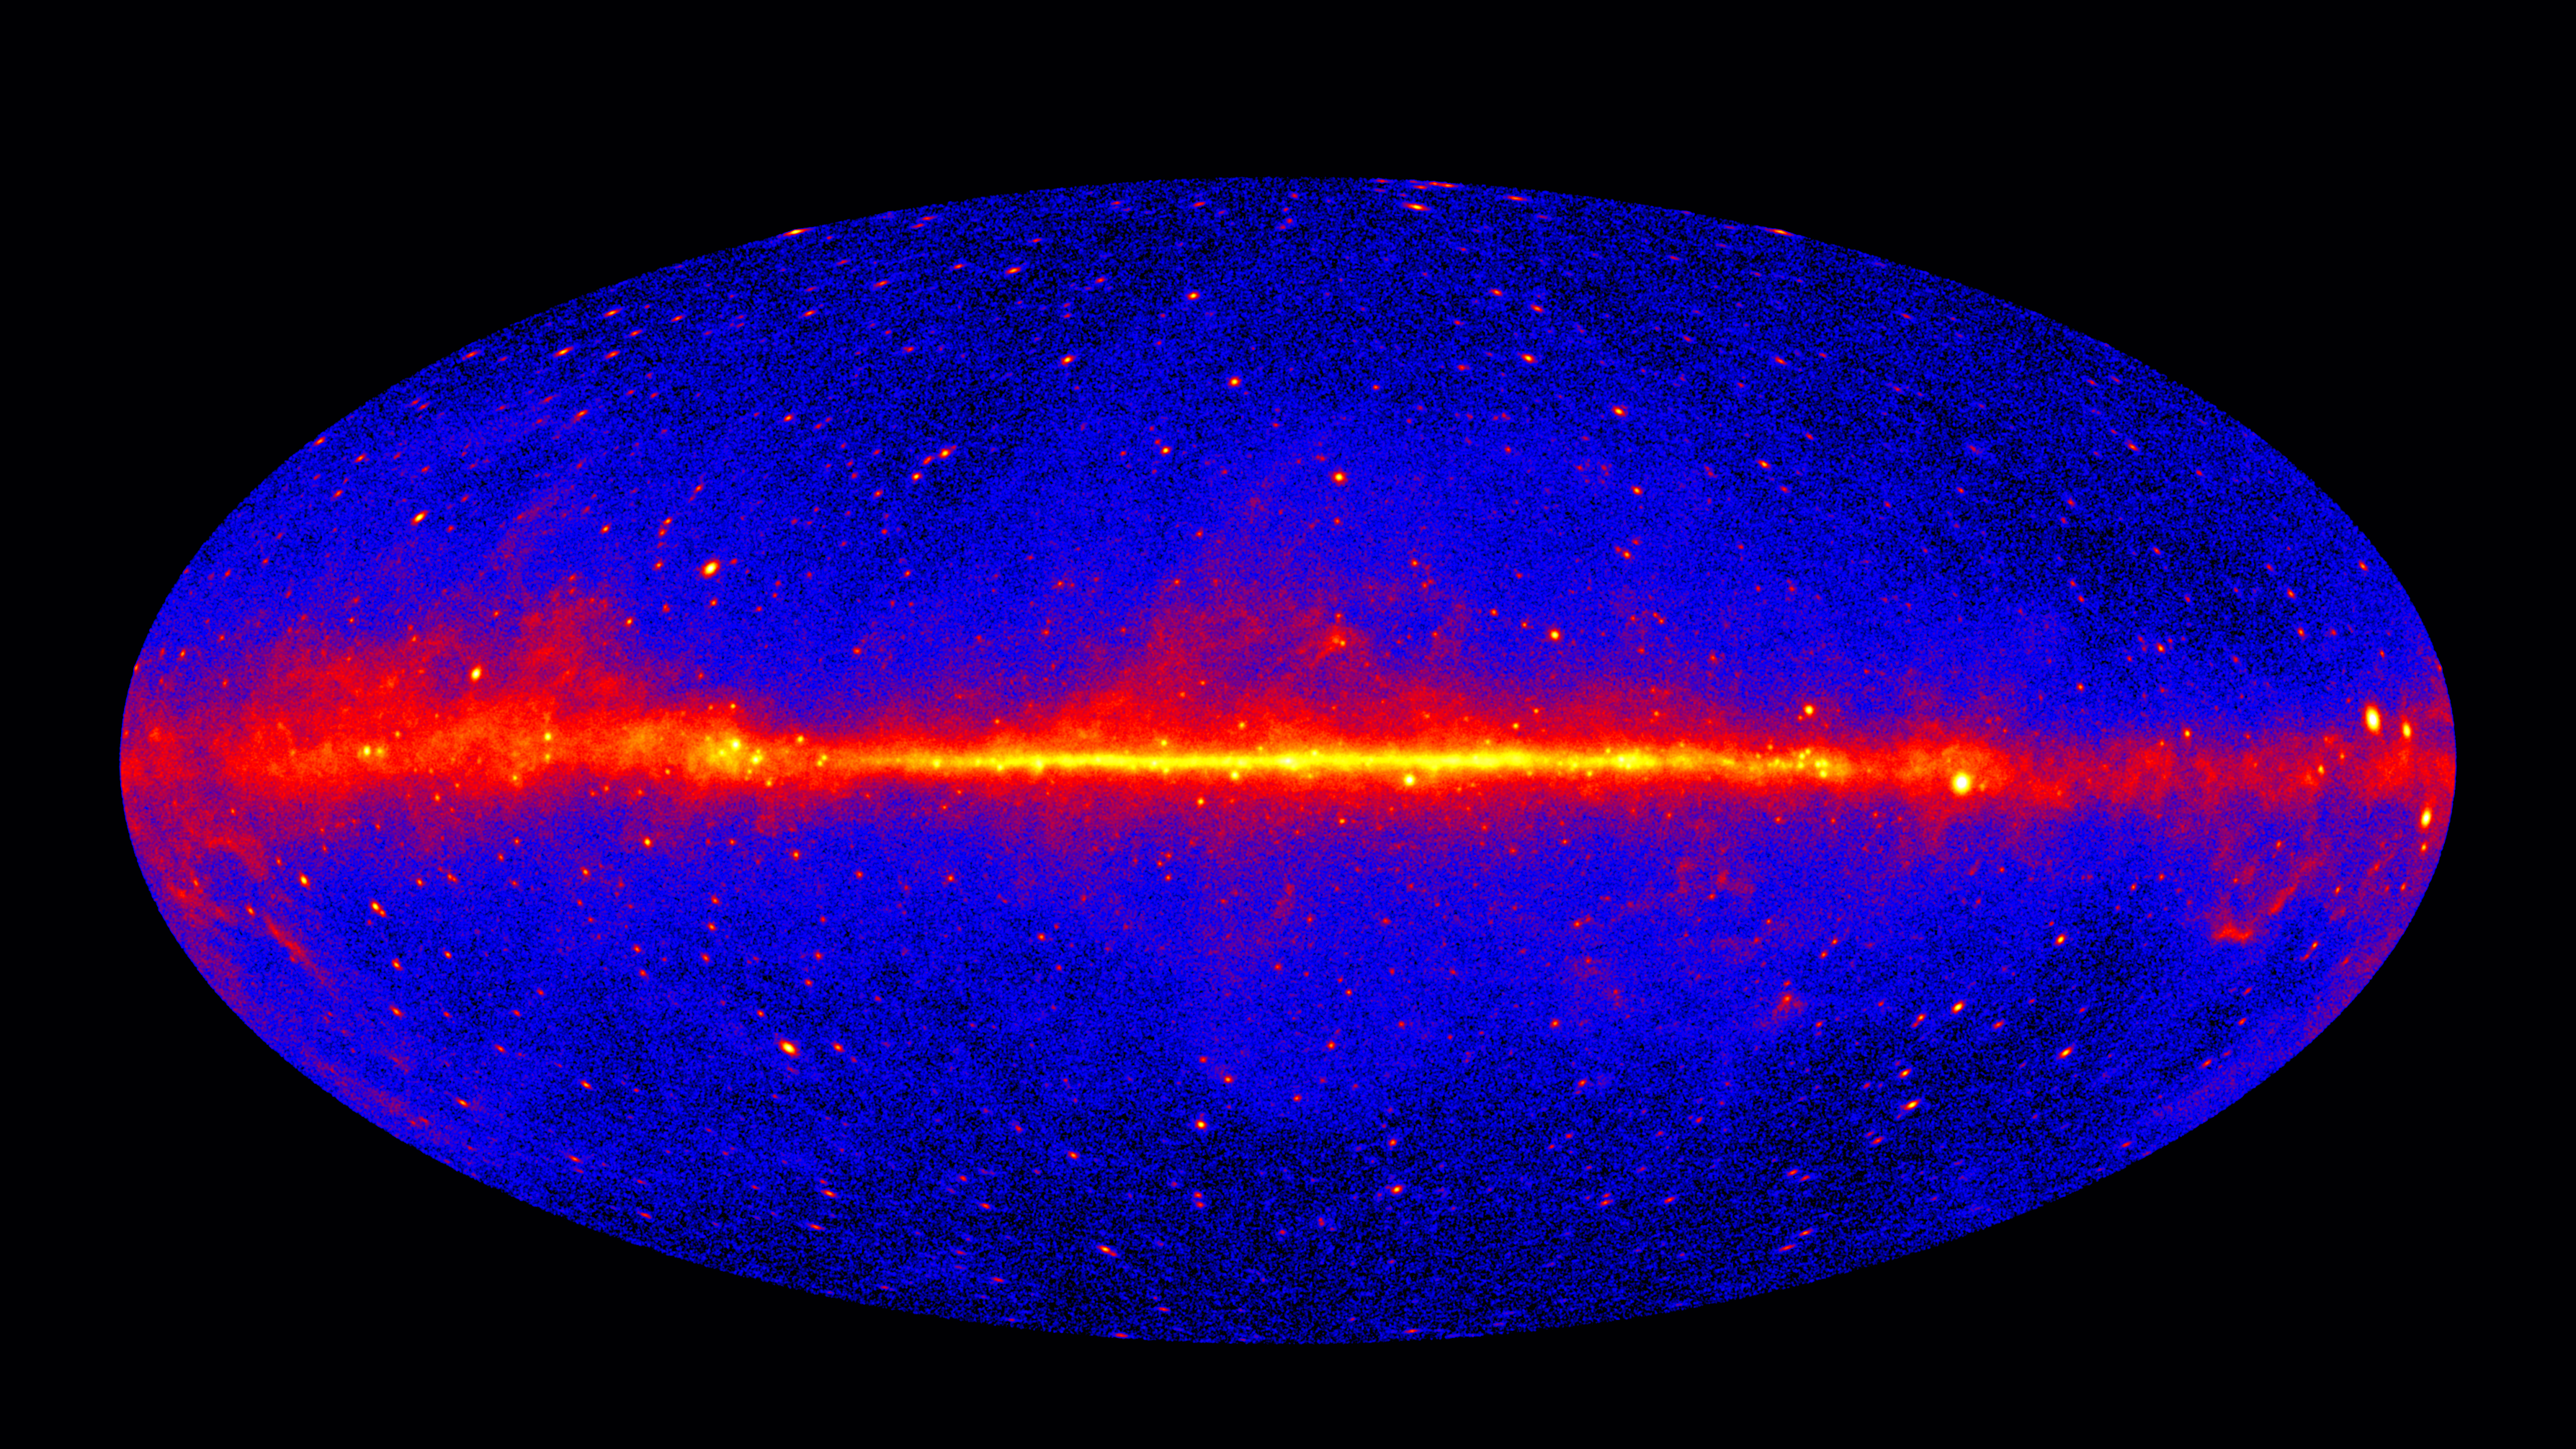
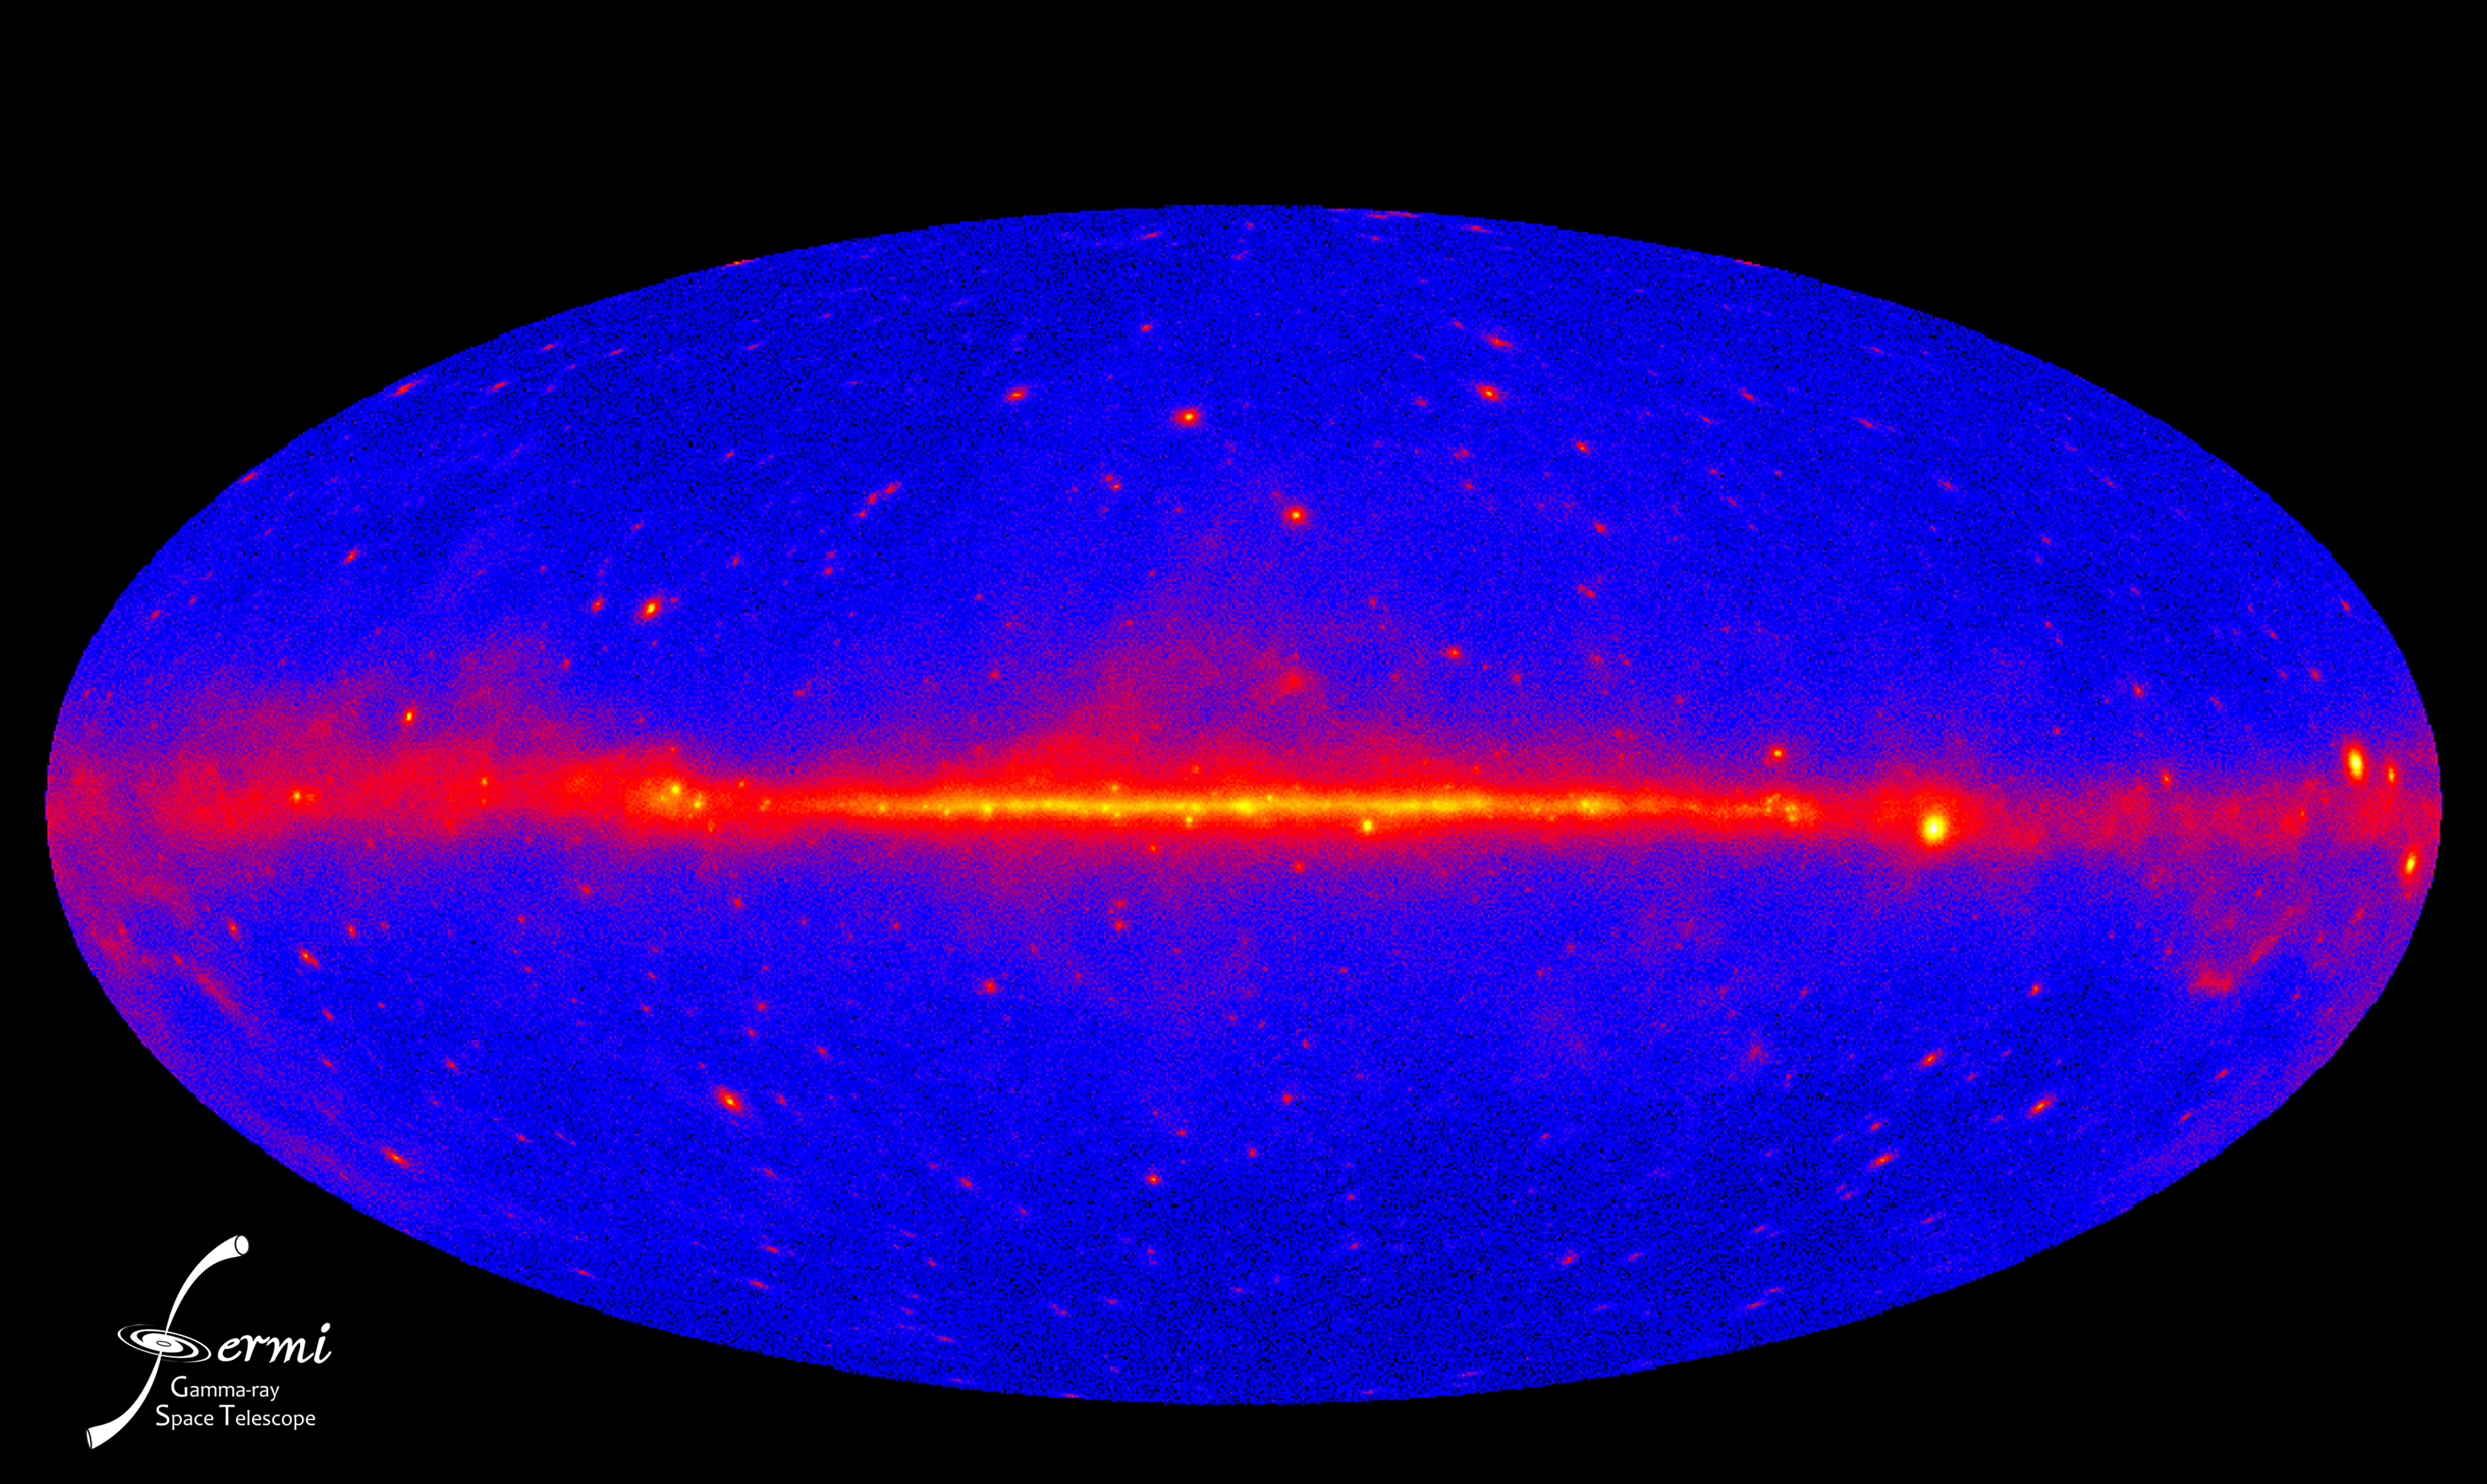
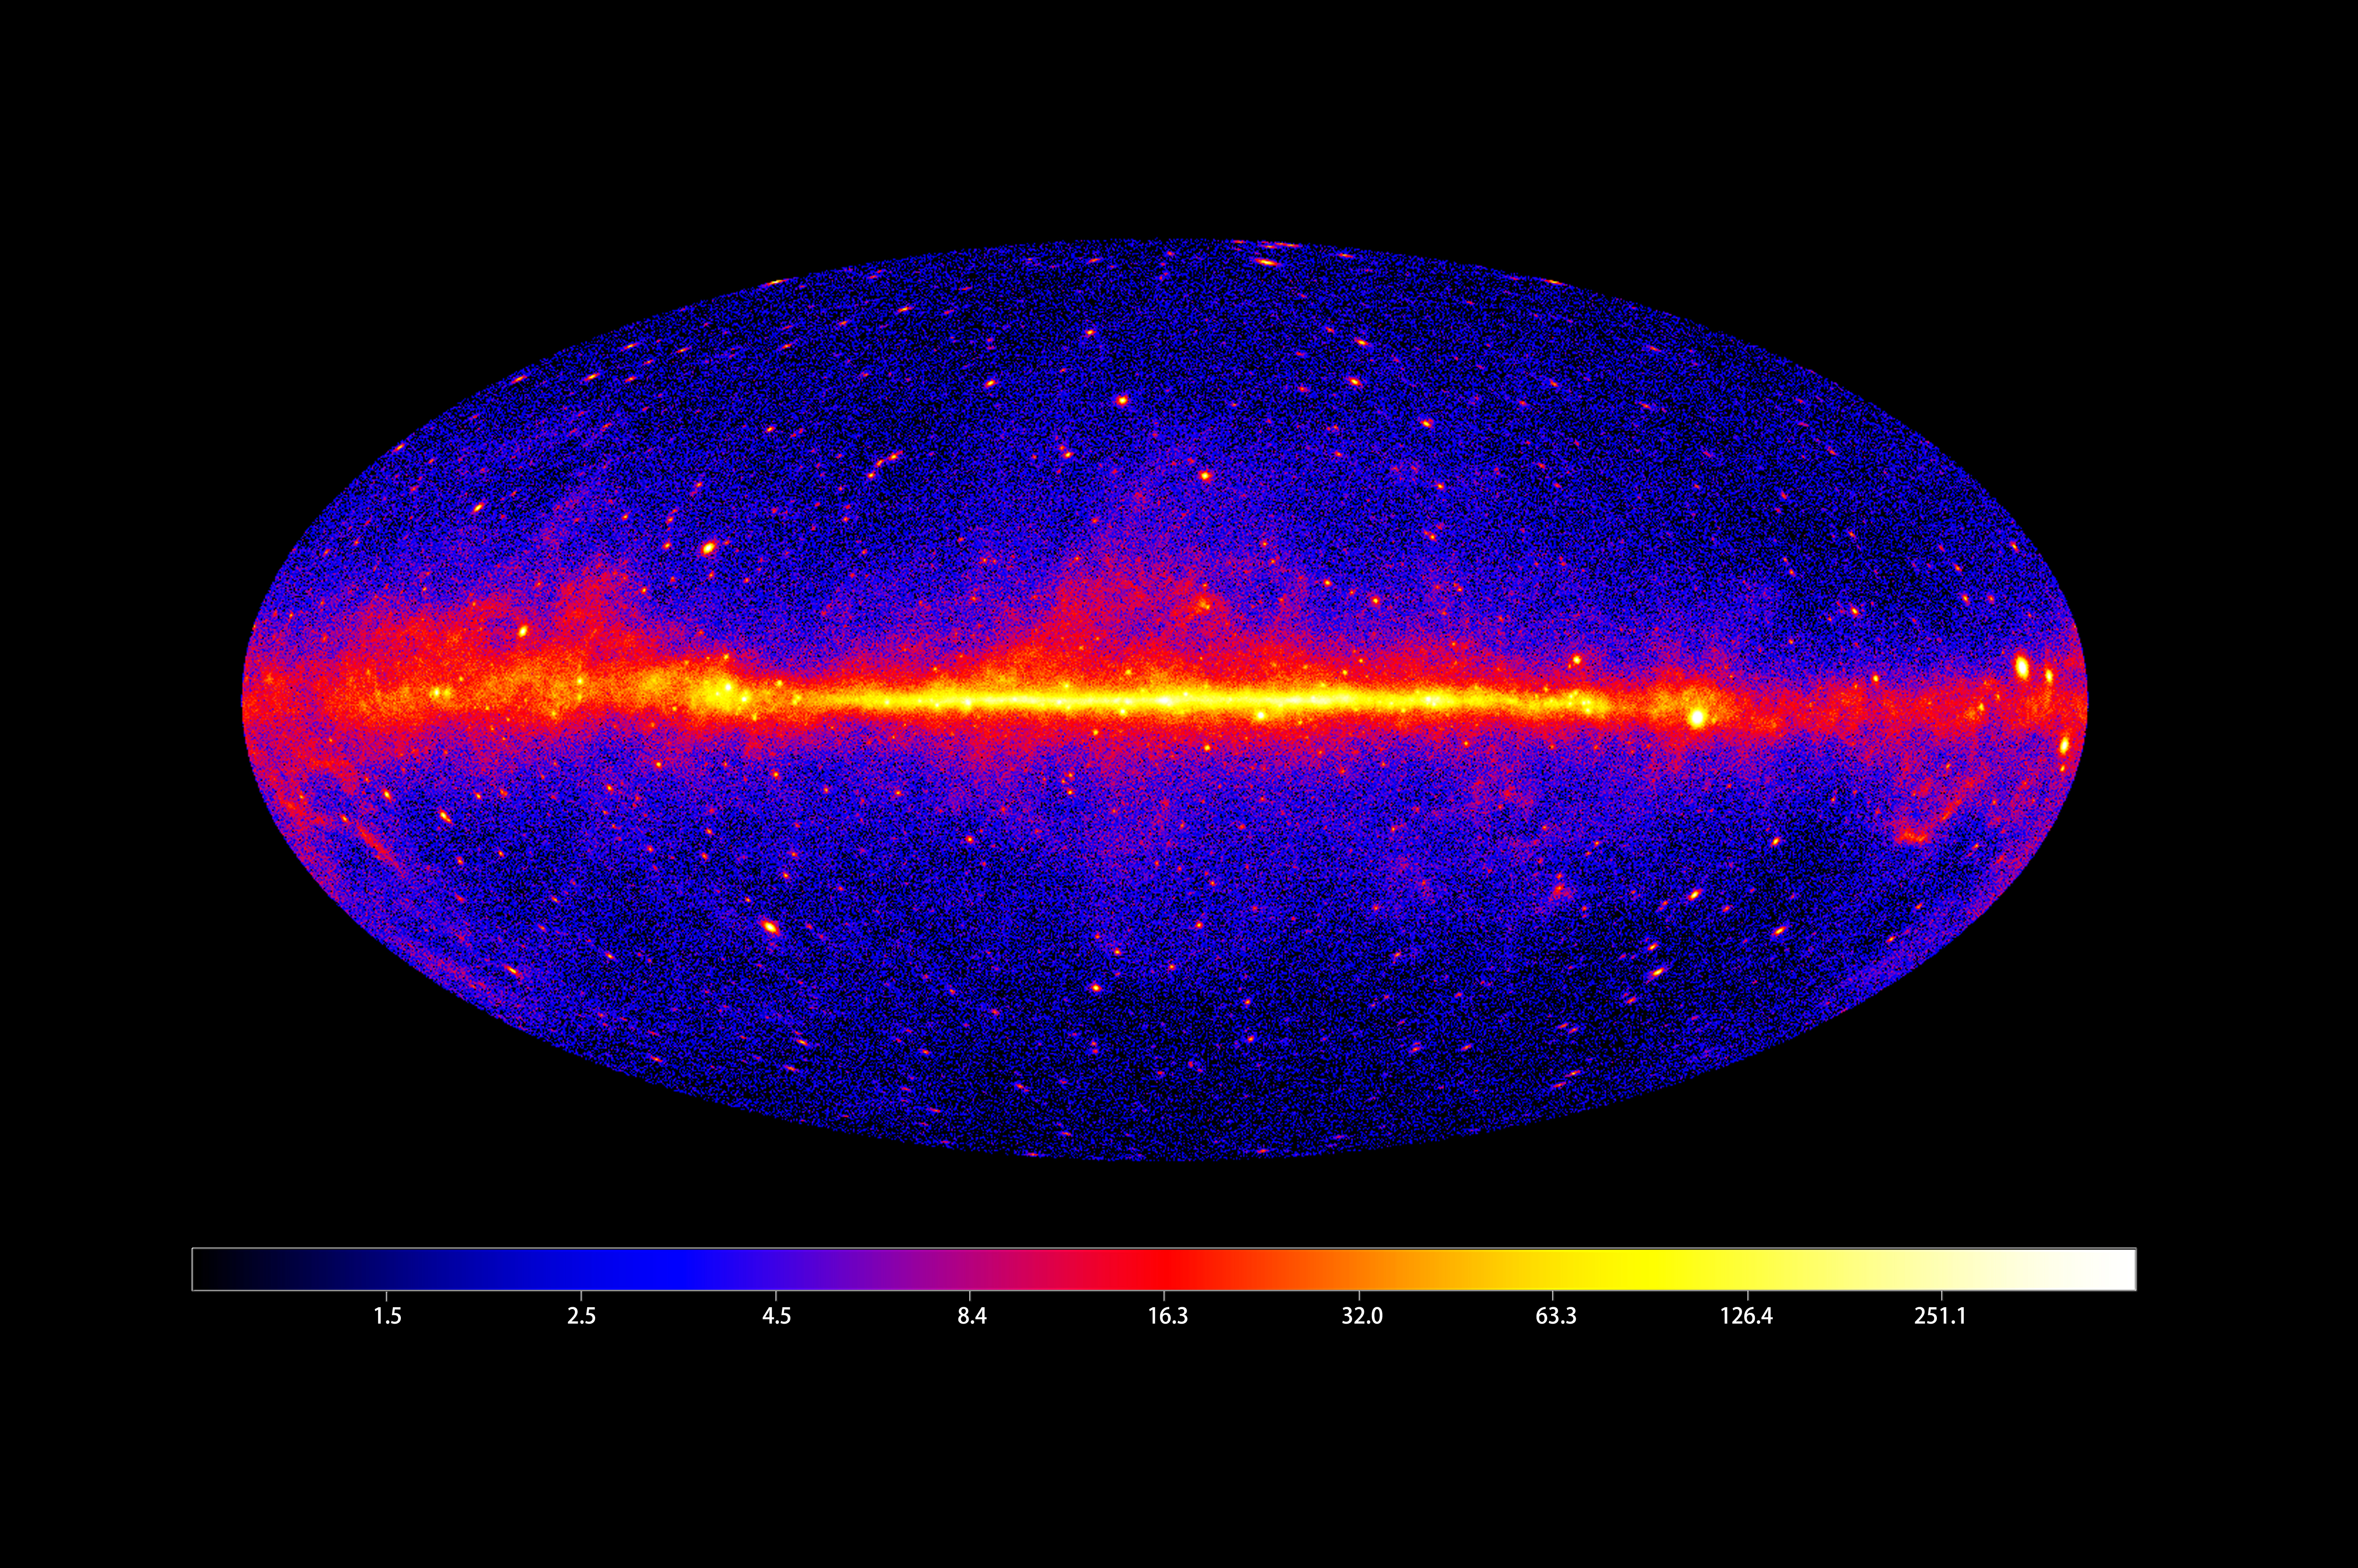
The Fermi LAT 60-month image, constructed from front-converting gamma rays with energies greater than 1 GeV. The most prominent feature is the bright band of diffuse glow along the map's center, which marks the central plane of our Milky Way galaxy. (Credit: NASA/DOE/Fermi LAT Collaboration)
Specific Science Topics
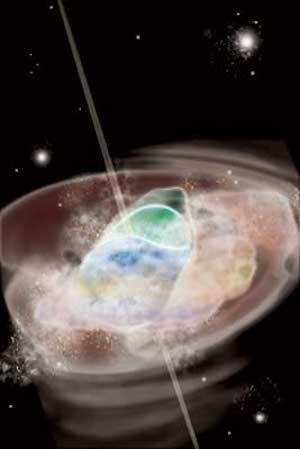
Illustration of a pair of neutron stars colliding. (Credit: Credit: NASA E/PO, Sonoma State University, Aurore Simonnet)
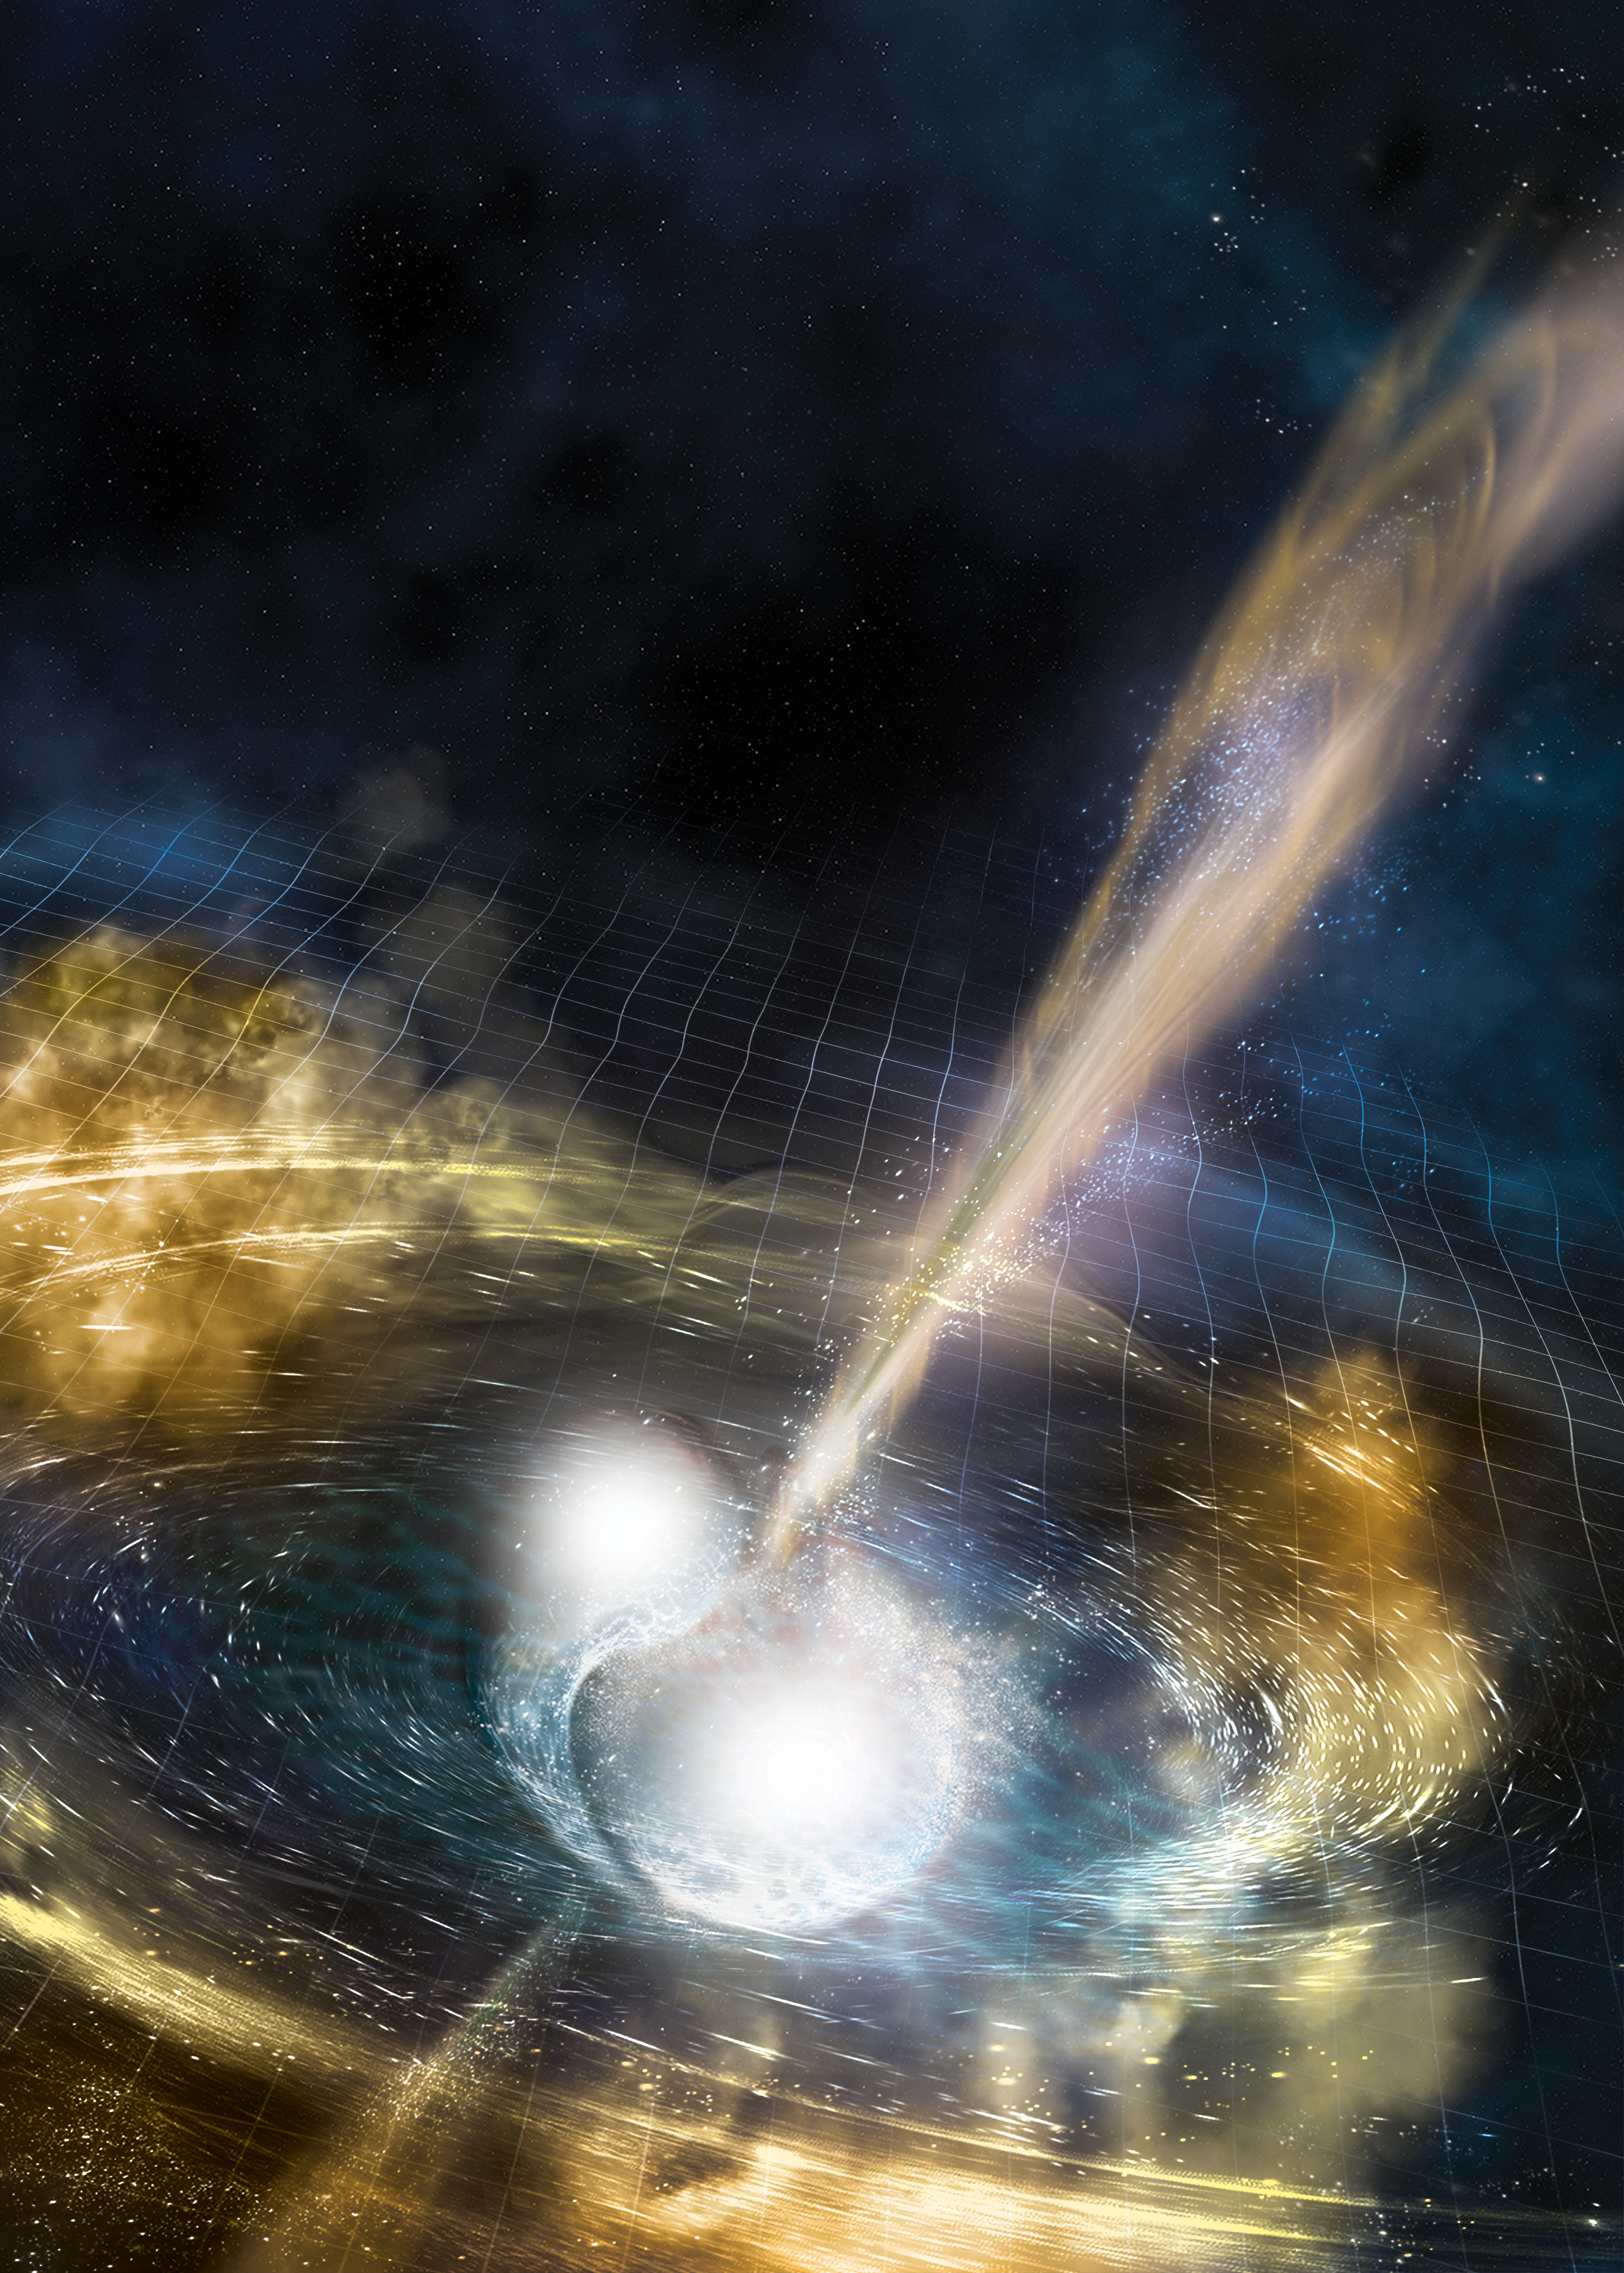
Illustration of two merging neutron stars. The rippling space-time grid represents gravitational waves that travel out from the collision, while the narrow beams show the burst of gamma rays that are shot out just seconds after the gravitational waves. Swirling clouds of material ejected from the merging stars are also depicted - these clouds glow with visible and other wavelengths of light. (Credit: Credit: National Science Foundation/LIGO/Sonoma State University/A. Simonnet)
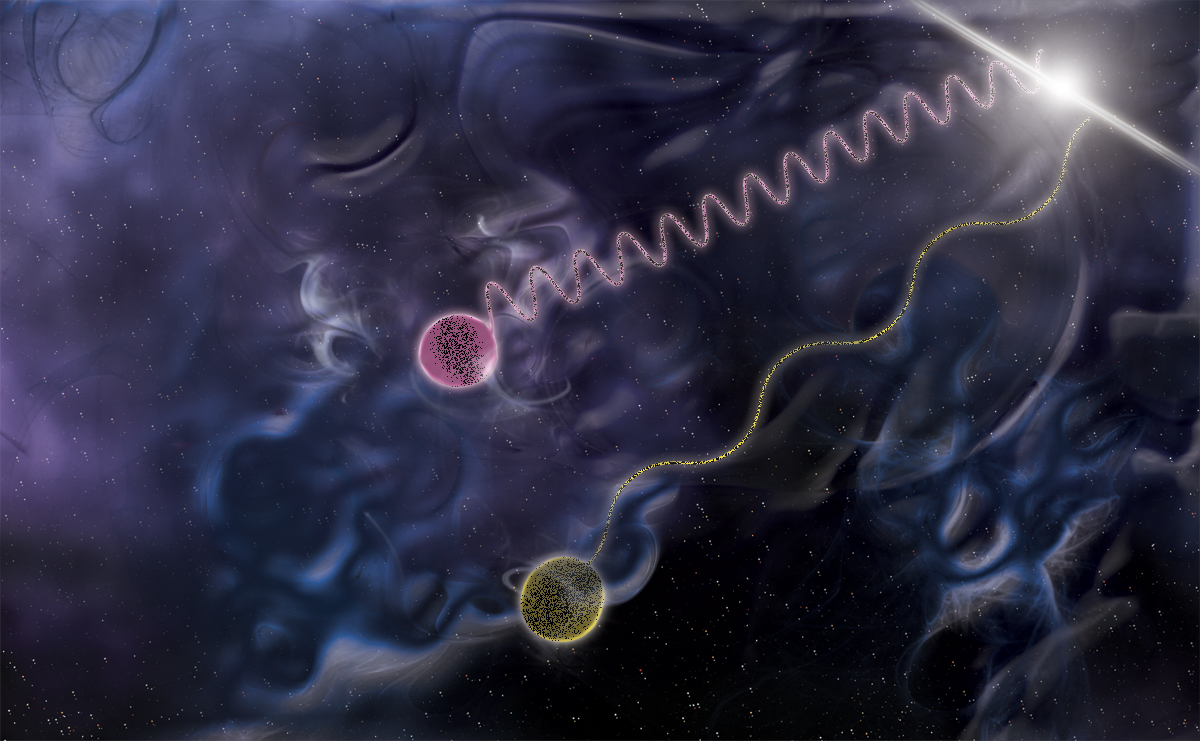
In this illustration, one photon (purple) carries a million times the energy of the other. Some theorists predict travel delays for higher-energy photons. However, Fermi data on two photons from a gamma-ray burst fail to show this effect. (Credit: NASA/Sonoma State University/Aurore Simonnet)
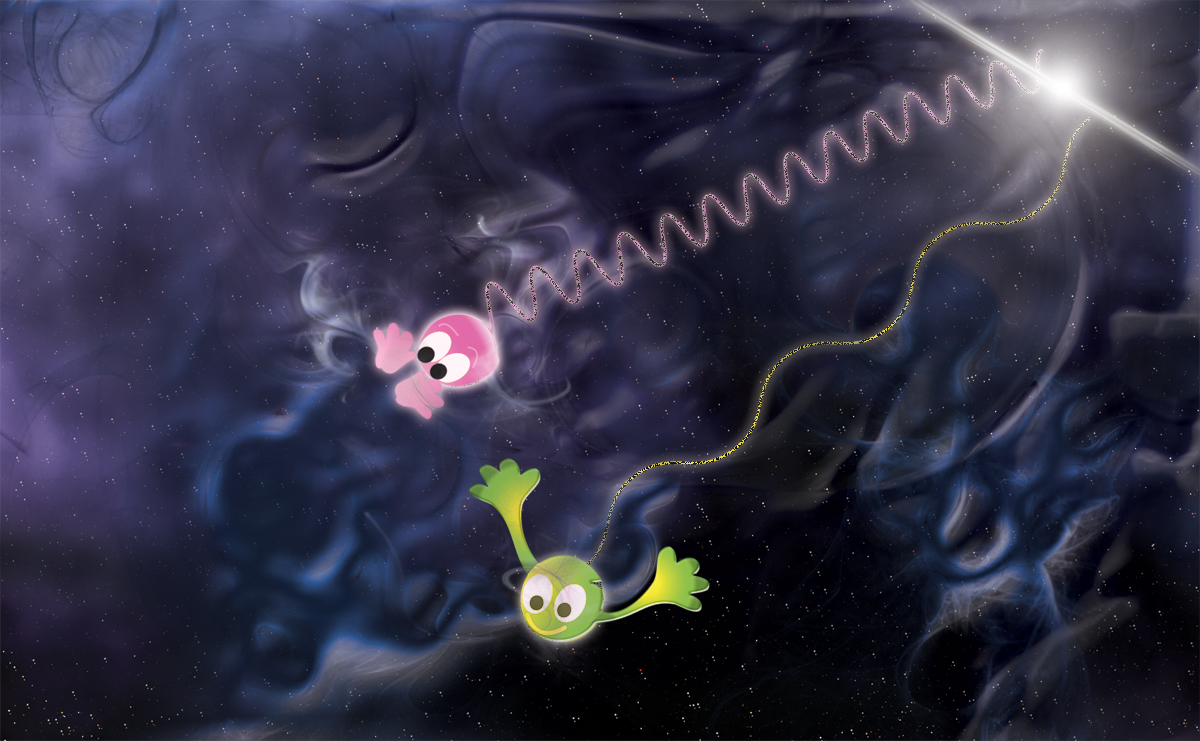
In this fun illustration, one photon (purple) carries a million times the energy of the other. Some theorists predict travel delays for higher-energy photons. However, Fermi data on two photons from a gamma-ray burst fail to show this effect. (Credit: NASA/Sonoma State University/Aurore Simonnet)
Pulsars are objects that emit broad gamma-ray beams and have enabled Fermi to locate a never-before-seen population. This image was on the cover of Science Magazine, August, 14, 2009. (Credit: NASA/U.S. Department of Energy/Fermi LAT Collaboration/Sonoma State University/Aurore Simonnet)
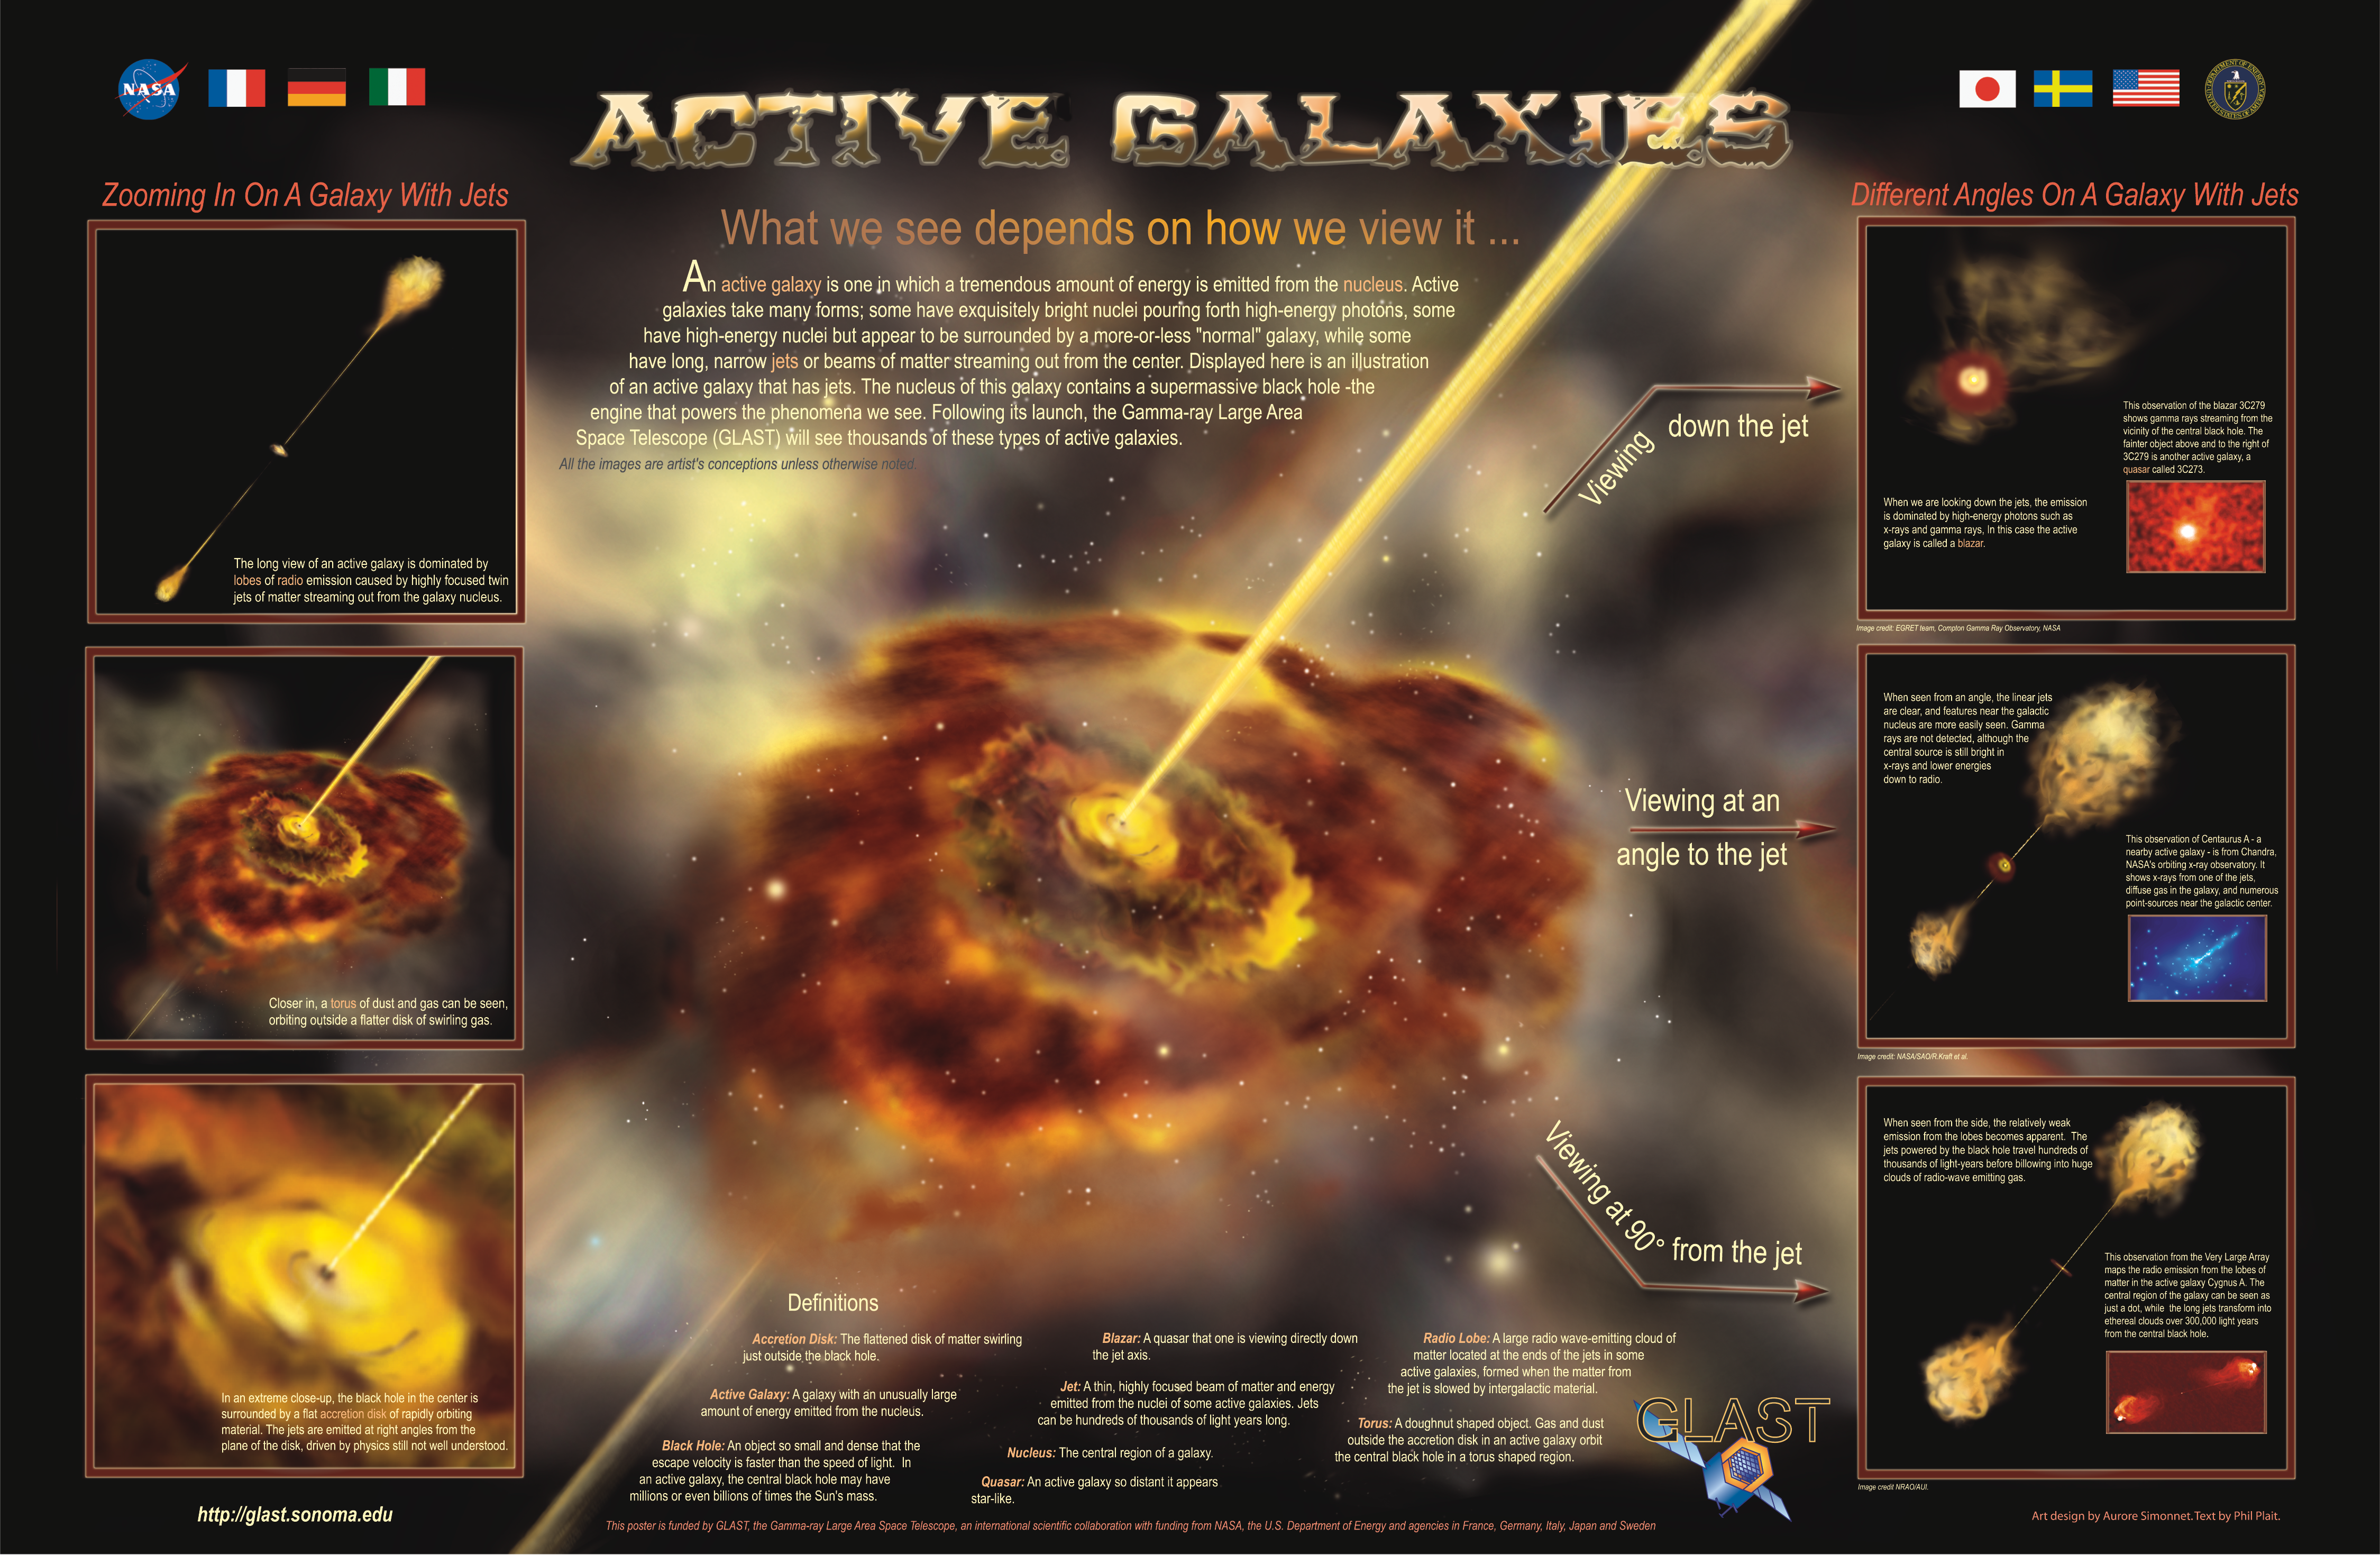
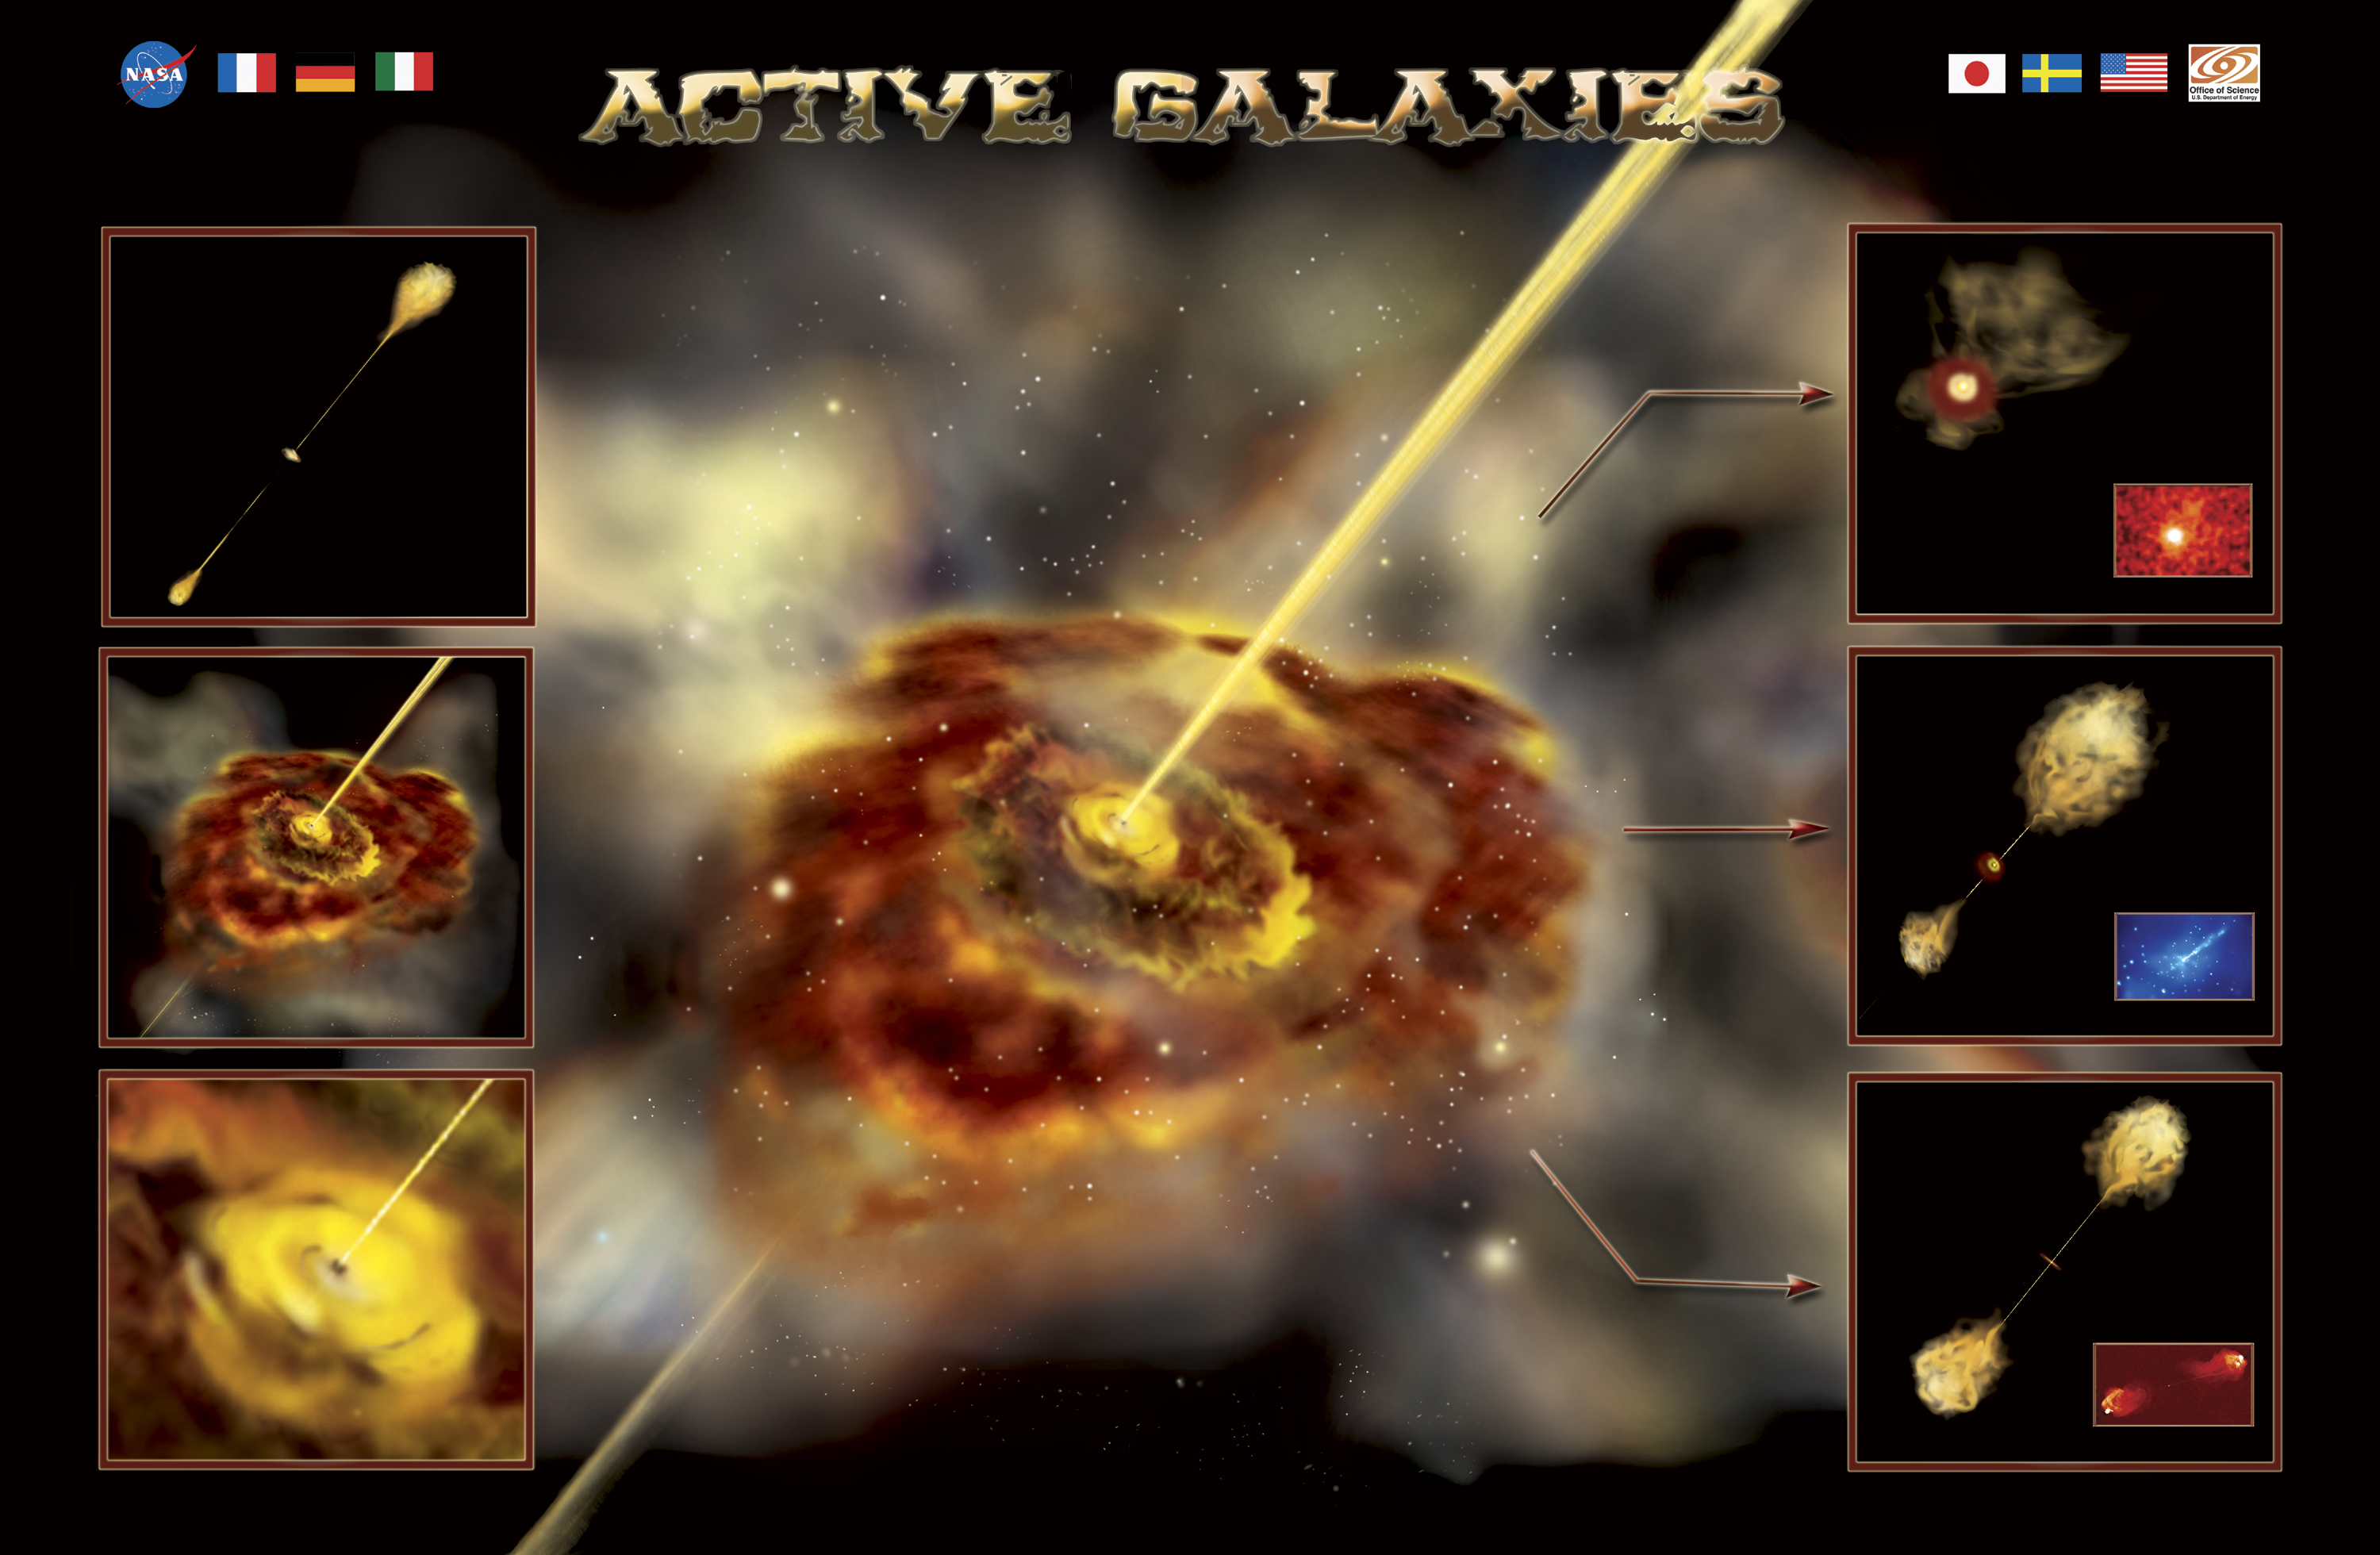
Poster illustrating active galaxies and how our viewing angle changes how we see them. (Credit: NASA E/PO, Sonoma State University, Aurore Simonnet)