

WMAP Special Exhibit
Testing inflation theory – What a difference a fraction of a degree makes in the weather
Cosmologists are scientists who study the origin and evolution of the universe. Naturally, they were excited about the launch of WMAP because the satellite aimed to sort out all the fantastic theories they had about where we came from and where we are going.
These theories all have models, or predictions, about what the microwave background should look like. One way that cosmologist view the microwave background is through a graph of temperature fluctuations measured within patches of the sky. The fluctuations will be slight, sometimes only 1/100,000th of a degree Celsius. And the patches are small too: one degree on the sky and less. (The entire sky measures 360 degrees, a unit of area or angular scale, not temperature.)
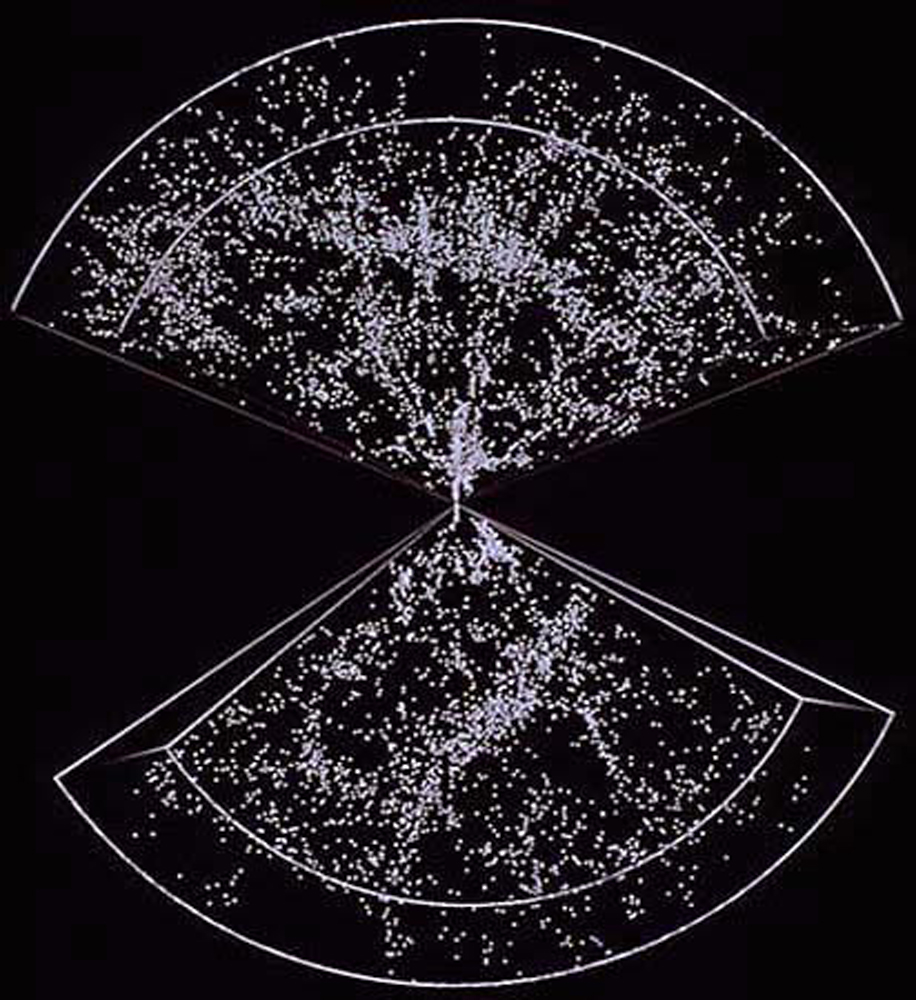
Large scale structure in the northern and southern hemispheres. Each of the 9,325 points in the image represents a galaxy. (Credit: Margaret J. Geller and Emilio E. Falco, Harvard-Smithsonian Center for Astrophysics)
The Big Bang is one theory about the origin of the universe, but it cannot explain why there is so much brilliant structure. An explosion produces a mess; yet the universe sports a wonderful hierarchy of planets, stars, galaxies, galaxy clusters and even walls of galaxies. Other theories, such as inflation, aim to complement the Big Bang theory in explaining the world as we see it today.
Inflation is an extension of the Big Bang theory in which the universe expanded from an atomic scale to a cosmic scale in a fraction of a second, making the universe geometrically flat. This rapid expansion, as you can imagine, would leave its stretch marks on the cosmic microwave background. Inflation was one of the prime theories that WMAP tested.
Inflation (and subsequent theories that complement it) predicts that the cosmic microwave background will have a series of "bumps" or very specific peaks in temperature fluctuations at very specific angular scales. The biggest bump will be at 1 degree on the sky.
Why 1 degree? First, remember that a degree is a physical distance, about twice the space covered by a full moon, and that inflation makes the universe flat #&150; no funky curves and hidden distances. Next, imagine the moment of inflation a mere instant after the Big Bang when the universe was nearly infinitely dense. Now think of the fog-bound universe over the next 400,000 years. Inflation sets the conditions for vibrations to wobble through the fog. Protons, attracted by gravity, would roll towards each other like marbles in a ditch. Photons trying to shine create radiation pressure pushing the protons out. This pushing and shoving in the fog creates what are essentially sound waves.
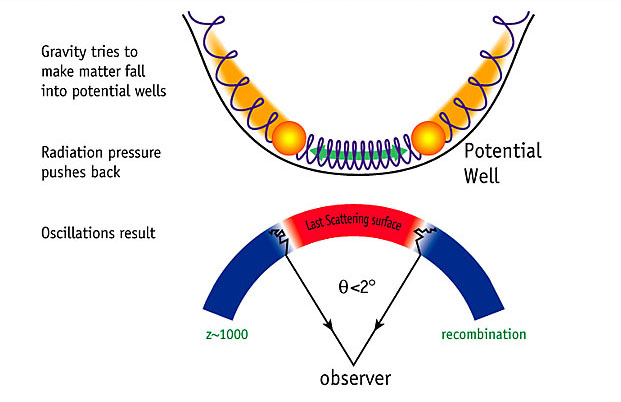
Sound waves arise from the interaction of matter and light in the gravity field of high density regions of the early universe. (Credit: NASA/WMAP Science Team)
One degree corresponds to the distance a sound wave could travel in 400,000 years in a flat universe. The temperature (and thus density) differences caused by inflation would be spaced across the sky in one-degree patches.
Picture a triangle. We are measuring one angle. From this we can determine the length "across" this angle on the sky because we know the speed of our sound wave and approximately how long it's been traveling (400,000 years). What we are after is the distance that the microwave radiation has traveled, the distance "out and away" from us, if you will.
A flat universe determines one distance; a curved universe determine another. If instruments measuring the cosmic microwave background don't see a peak temperature fluctuation at one degree, then inflation is wrong. If the peaks are at two degrees, for example, then space must be curved like a sphere (much like the Earth). Then matter and sound can travel a greater distance in 400,000 years.
Inflation has passed this first test. In 1999, a telescope on a mountain top in Chile first detected this characteristic scale. In 2000, this was confirmed and measured more accurately by a pair of balloon-borne telescopes and a telescope operating at the South pole. But there are more hurdles to clear. Other temperature peaks at even smaller angular scales -- 0.5 to 0.01 -- correspond to other predictions of inflation theory.
This is where WMAP came in. WMAP's thoroughness down to angular scales of 0.2 degrees essentially smoothed out the discrepancies among data from the many recent non-satellite experiments. WMAP looked for bump after bump, with each one – just like the main temperature fluctuation at one degree – saying something very specific about the nature of the universe.
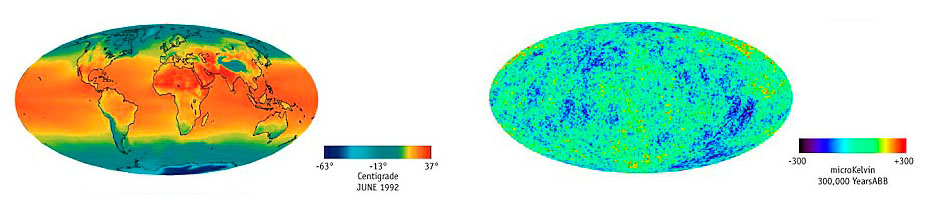
A comparison of temperature variations on the Earth
with those of the cosmic microwave background. (Credit: NASA/WMAP Science Team)
Published: July 2001
Text Reviewed: September 2018