Graphing Spectra - A Student Worksheet
Part II.
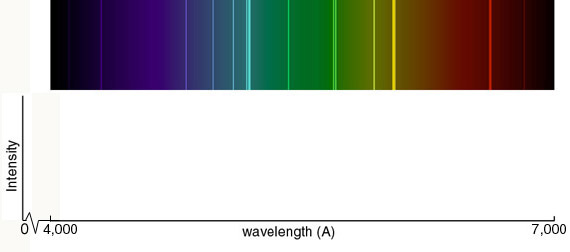
The following
spectrum represents the energy state of the
element, carbon. Carbon's
emission lines in the
visible range are a function of
wavelength from
4,000
to 7,000
angstroms. You are going to create a graphical representation of
carbon's spectrum from the photographic representation. Refer to the
example above to help. At the particular wavelengths, illustrate the
varying brightness of carbon's emission lines. Notice that in the
photographic representation of the spectrum there is an underlying
continuum of emission, in addition to the bright
spectral lines. This
continuum is due to contamination of the spectrum by ambient
light, such
as small amounts of white light that are picked up by the
spectrometer.
Your graphical representation should include this low level of emission at
all wavelengths as well as carbon's spectral line features.
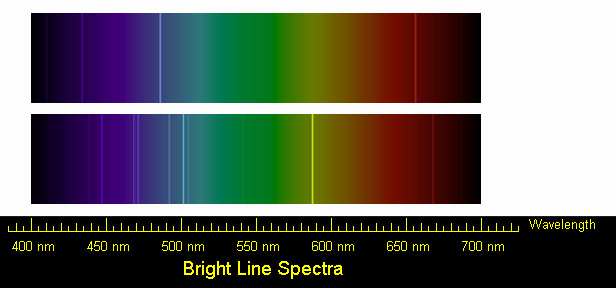
Below you are given spectra for both hydrogen and helium. For each
element, select two of the brightest emission lines and measure the
wavelengths. The scale of the spectrum is
indicated by the ruler below.