

Lightcurves and What They Tell Us
A light curve is a graph that shows the brightness of an object over a period of time. In the study of objects that change their brightness over time such as novae, supernovae, and variable stars, the light curve is a simple, but valuable tool to a scientist. A sample light curve is shown below
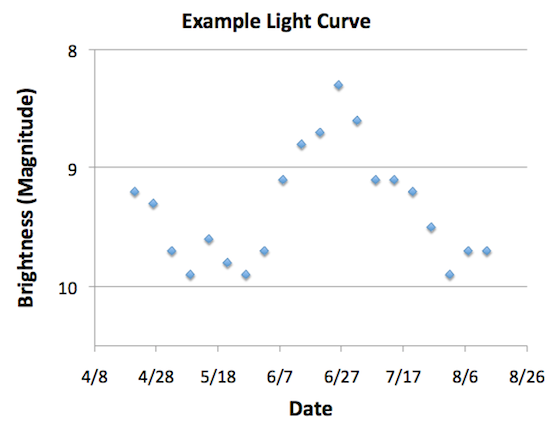
This is the graph, or plot, generated from the following data:
| Date | Brightness (Magnitude) |
Date | Brightness (Magnitude) |
|
| April 21 | 9.2 | June 20 | 8.7 | |
| April 27 | 9.3 | June 26 | 8.3 | |
| May 3 | 9.7 | July 2 | 8.6 | |
| May 9 | 9.9 | July 8 | 9.1 | |
| May 15 | 9.6 | July 14 | 9.1 | |
| May 21 | 9.8 | July 20 | 9.2 | |
| May 27 | 9.9 | July 26 | 9.5 | |
| June 2 | 9.7 | Aug 1 | 9.9 | |
| June 8 | 9.1 | Aug 7 | 9.7 | |
| June 14 | 8.8 | Aug 13 | 9.7 |
Here we have shown how bright the object would look to us through a telescope if we measured it every 6 days for a few months. Plotting these data gives a light curve of the object we have measured. But light curves can be generated for any physical measurement which is repeated over time. For example, if we measured the number of X-rays being emitted by a star during every second for an hour, we could generate a light curve using those observations. Or we could count how many people passed in front of us during a ten minute time interval while we sat on a park bench during our lunch hour. We could generate a light curve for this as well, but it would have no astronomical value (of course!). Astronomers call them light curves because the measurement involved is usually some part of the electromagnetic spectrum (i.e. light) that we measure as a function of time and use to help us understand our universe.
How do we use light curves to tell us something useful?
The record of changes that a light curve provides can help an astronomer in understanding both the processes at work within the star (or stellar system) and to identify specific categories (or classes) of stellar events. For example, once a light curve has been made for a stellar object, it can be compared to standard light curves to help identify the type of object that is being studied.
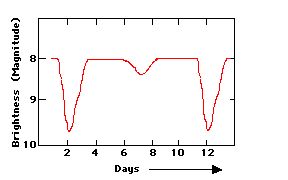
If the light curve you measured looked like the one below, then you could identify your object as an eclipsing binary star. We can also tell from this light curve that it takes 10 days for one of the stars in the binary to orbit around the other one complete time. Astronomers would say that the orbital period of the binary system is 10 days.
 Quiz your knowledge of light curves
 See a light curve for M31 and to try this technique to solve for its velocity.
