

Examples of Redshifted Spectra from Galaxies
The images below show historic spectra and images of several galaxies. Each galaxy was observed to be traveling toward or away from ours with a different velocity – by convention, negative velocities indicate motion toward the observer and a positive velocity indicates a motion away from the observer. The velocities are determined by the shift of the spectral lines.
In the image of each spectrum, the middle section shows the observed galactic spectrum. The lines shown on the top and bottom of each spectrum are the characteristic lines of hydrogen as it appears in the laboratory (at rest). The red arrow in the NGC 221 spectrum indicates the segment of the galaxy's spectrum that is of interest – the bright hydrogen line. In each spectrum, that line is shifted in comparison to the laboratory spectrum. The horizontal arrow in the other spectra indicates the extent of that shift. Study the diagrams carefully, and you will notice that the galaxies displaying higher velocity show the greatest Doppler shift.
In the raw data, the horizontal axes of the spectra would be labelled "wavelength" or "energy." Measuring the shift in wavelength from the laboratory frame enables you to calculate the galaxy's velocity.
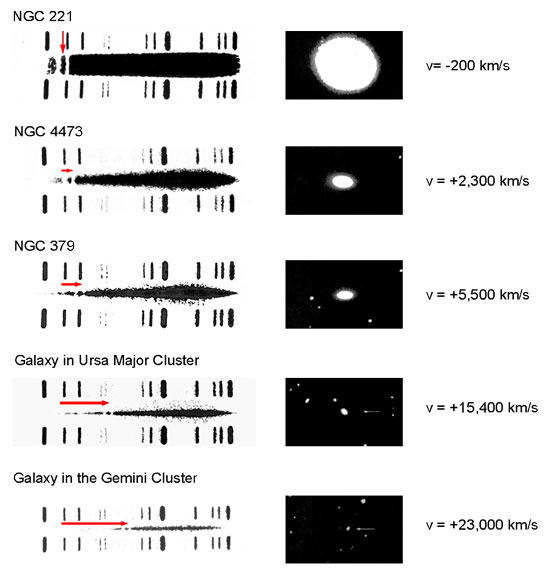
(Credit: Humason, 1936, The Astrophysical Journal, 83:10)
