What we know about gamma-ray bursts
How they look as functions of time and energy


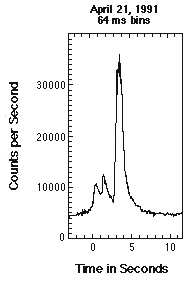
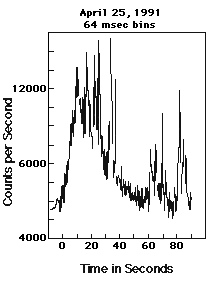
Perhaps the most striking feature of the time profiles of gamma-ray bursts is the diversity of their time structures. Some burst light curves are spiky with large fluctuations on all time scales, while others show simple structures with few peaks. However, some bursts are seen with both characteristics present within the same burst. In a few cases, burst sources have repeated their appearance, but there have been no persistent, strictly periodic behavior observed in gamma-ray bursts.
The durations of gamma-ray bursts range from about 30 ms to more than 1,000 s. However, the duration of a gamma-ray burst is difficult to quantify since it is dependent on the sensitivity and the time resolution of the detector that observes the event. The "tip of the iceberg" effect tends to cause weaker bursts to be observed as shorter bursts, since only the brighter parts of the burst are observable.


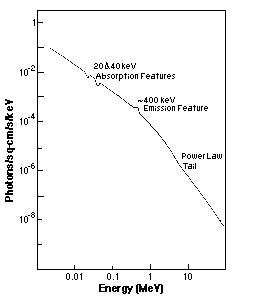
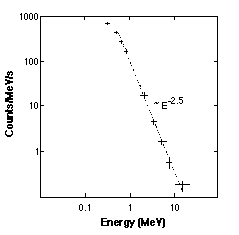
A unique feature of gamma-ray bursts is their high-energy emission: almost all of the power is emitted above 50 keV. Simultaneous soft (lower-energy) X-ray emission has been seen in a few cases, with the power in the soft X-rays being only a few percent of the power found in the gamma-ray region. The energy spectra can usually be fitted by an optically thin bremsstrahlung-like shape, although other shapes can be used.
Distribution and brightness
The most direct evidence of the 3-D spatial distribution of the sources of gamma-ray bursts comes from the observed intensity and sky distributions. The angular (sky) distribution provides two of the dimensions of the spatial distribution, while the intensity distribution is a convolution (the combination of two signals to form a third signal) of the unknown luminosity function and the radial distribution. Even though the luminosity function is unknown, the intensity distribution can still provide constraints on the allowable spatial distributions of gamma-ray burst sources.
Can we at least tell how far away gamma-ray bursts are? Actually, no, not with any certainty. From the early 1970s it has been apparent that gamma-ray bursts come from all parts of the sky with approximately equal probability. Since other aspects of gamma-ray bursts (such as the fast rise time [<1 ms in some cases] and high photon energies) seemed consistent with a neutron star origin, most people prior to 1991 believed that gamma-ray bursts came from galactic neutron stars, and that instruments simply hadn't had the sensitivity to probe deeply enough to see a bias towards the galactic center and plane. However, since 1991 the Burst and Transient Source Experiment (BATSE) aboard the Compton Gamma-Ray Observatory has seen nearly one gamma-ray burst per day, and these too are nearly isotropic (click for the sky map of the first 921 bursts or here for a movie of the first few hundred bursts). It is believed that, if galactic neutron stars really are the sources of gamma-ray bursts, BATSE should be able to see them far enough away that the distribution should be more like a pancake than a sphere. Another piece of evidence comes from the number of sources seen with at least a given flux. If the universe were Euclidean and the sources were spread out uniformly, then out to a distance r there would be a number of sources proportional to r3, and the dimmest sources would have fluxes proportional to 1/r2. Thus, in a Euclidean universe with uniformly distributed sources of a given intrinsic luminosity, a plot of log N (N=number of sources at a flux greater than S) versus log S should have a slope of -3/2. At the highest fluxes this slope is seen, but at lower fluxes the slope becomes smaller, exhibiting a continuous rollover and becoming about -0.8 at the lowest fluxes BATSE can see.
What does that mean? The dropoff at lower fluxes, which corresponds to greater distances if the intrinsic luminosity is constant, means that in some sense there is an edge to the distribution. For example, if the sources were distributed in a thin plane instead of a sphere, the slope would be -1, and for sources in a line the slope is -0.5. Even if the source distribution is spherical, the slope will roll over if the sources become less dense at greater distances, or if the flux drops off faster than 1/r2. Because of the isotropy of the distribution, many people believe that gamma-ray bursts are cosmological, at typical redshifts z=1, where the redshift would decrease the flux in about the right way to account for the log N - log S rollover.
Other Links within this Topic
- Gamma-Ray Bursts
- What We Know About GRBs
- Searching forCounterparts
- Models of GRBs
- Movie Showing BurstLocations


