Below are the answers to the “Think About” questions.
The energy decreases. This is because the energy is inversely proportional to the wavelength: E = hc/l
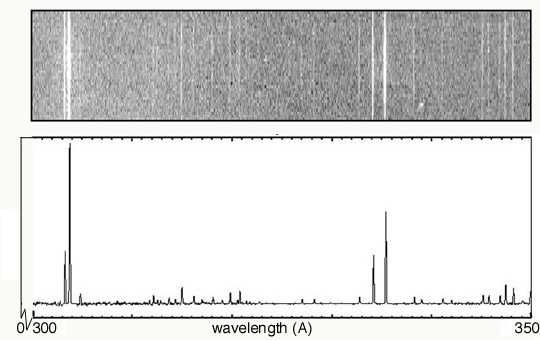
The varying heights represents the different intensities of the lines. The lines in the left-most portion of the spectrum are brighter than any of the others.
The y-axis should be labeled as “Intensity”.
In the top image, it is represented by the brightness of the line. In the bottom plot, it is represented by the height of the line.
Keeping the usual sense of values increase from left to right, the order the emission lines would be flipped left-to-right. That is, the brightest lines would be on the right.
From the spectra, we can identify the emission lines. With knowledge of the characteristic emission lines of various elements, we could then identify the elements giving rise to this spectrum.