Since we can't hop in a spaceship and visit objects across the Galaxy, let alone across the Universe (we can't even visit places across the Solar System in person – we need unmanned spacecraft for that, at least for now), astronomers can only study these distant objects using the light they emit. By studying the light from objects, astronomers can learn a great deal about the object. For example, they can measure the amount of energy coming from the source (creating a spectrum), they can produce an image of the source (creating a image), and they can changes in the light over time (making a light curve). Different detectors on telescopes are good at different ways of collecting light, so one detector might be really good at images, but not as good at spectra.
Here is a little more information about each of the types of information astronomers can create with the light from an object.
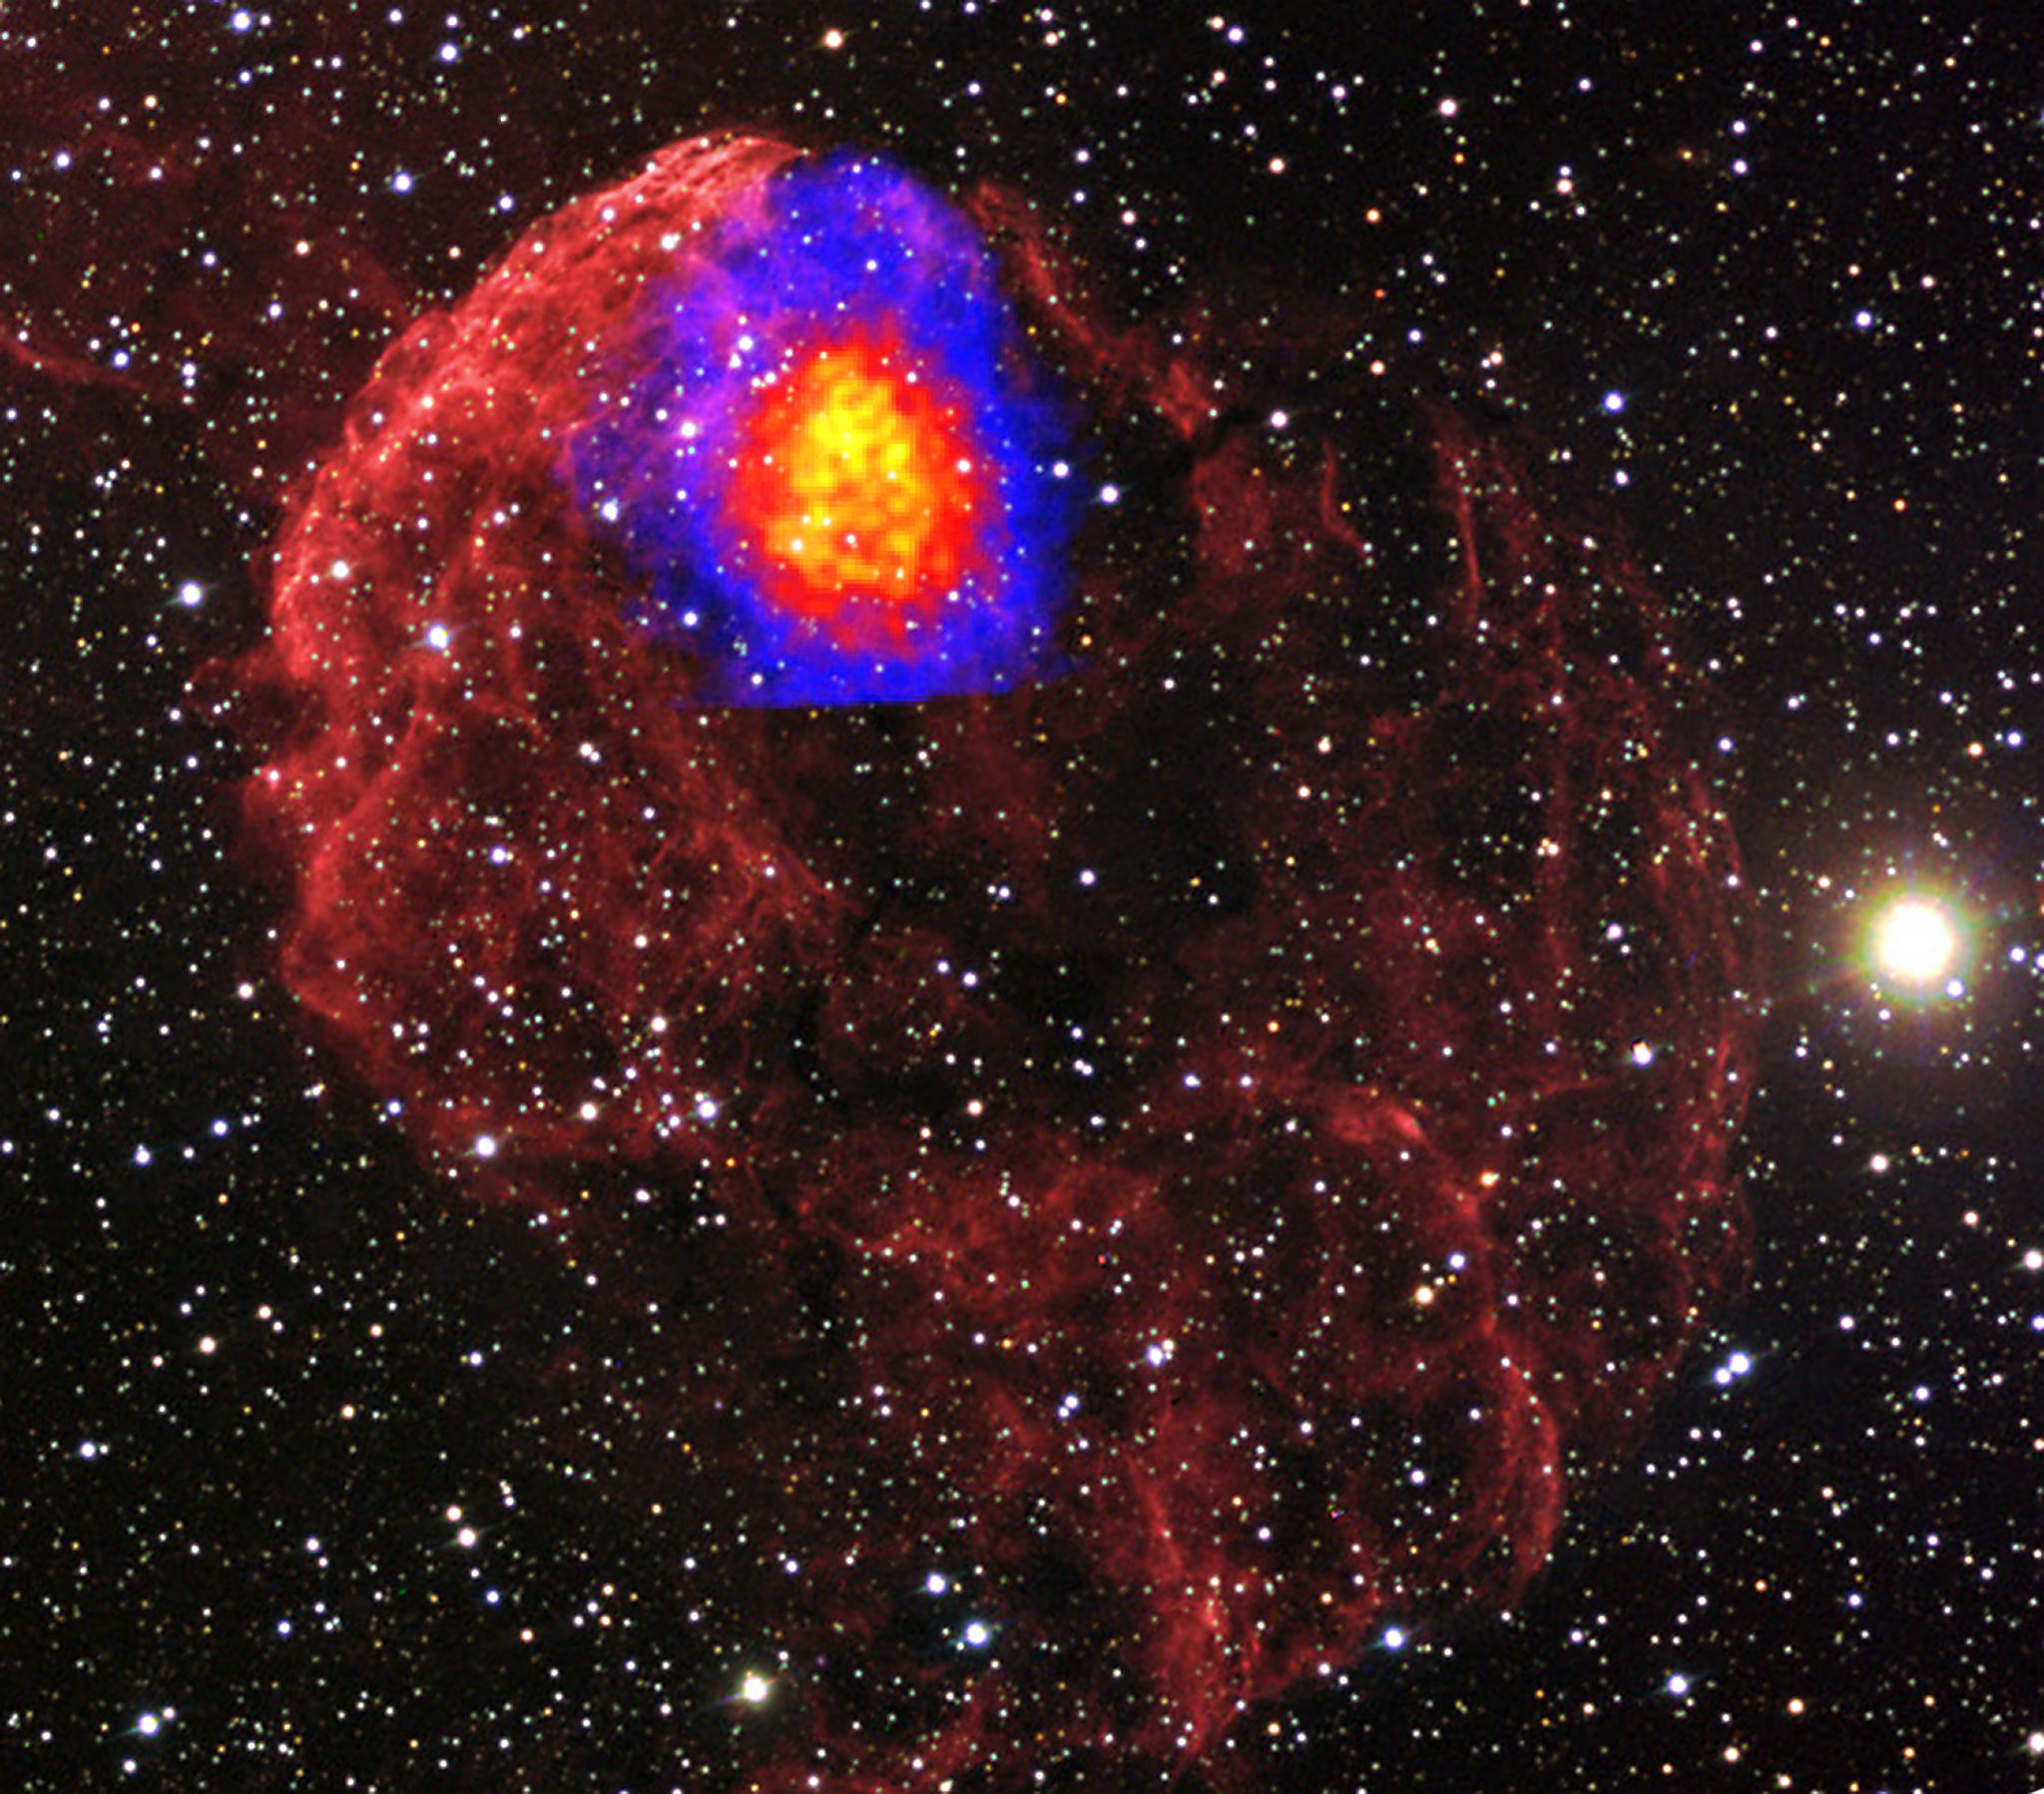
You are probably most familiar with the concept of an “image”. When you take a picture with your camera, you are capturing the distribution of light coming into the shutter. Similarly, telescope optics work by focusing light into an eyepiece or a camera, by reflecting the light with mirrors or refracting it with lenses. Either way, the image created from incident light from space gets magnified, allowing us to capture spatial images of the sky. In much the same way, an X-ray telescope can concentrate the light from an X-ray star onto a small portion of an electronic eye. This detector can then record both how many photons are hitting it, which tells us about the brightness of a source, and the location where the X-ray photon strikes it, which tells us its position. Such an “imaging detector” can view several X-ray emitting objects simultaneously, like a cluster of stars, or can create pictures of regions from which diffuse X-ray emission arises, like a cluster of galaxies.
If you wanted to be able to distinguish the core of a galaxy from its surrounding disk, then you would want your detector to have good spatial resolution. Spatial resolution is a telescope's ability to tell sources apart even if they are very close together in the sky.
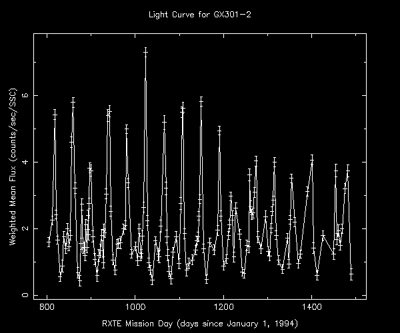
A light curve is a graph of intensity over time. Such a graph is made by counting the number of photons coming from a source over a period of time. For example, by counting the number of X-rays being emitted by a star every second for an hour, you could generate a light curve from your observations. Your light curve would tell you how bright your source is and the amount of time it remained at that brightness. A graph similar to a light curve can be generated for any physical measurement which is repeated over and over in time. You could count how many people passed in front of you during a ten minute time interval while you sat on a park bench during your lunch hour. You could generate a “light curve” for this as well, but it would have no astronomical value (of course!).
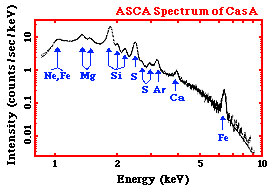
Spectroscopy, the study of spectra, is simply the science of measuring and graphing the intensity of light at different energies. X-ray light contains a range of energies just like visible light, with its range from reds to blues. Satellites like Suzaku have spectrometers on them. A spectrometer counts the number of photons of differing energies hitting it. A graph of the number of photons over an energy range can tell us how the source is producing its X-rays, and give us clues as to what kind of object it is!
The key to the usefulness of spectroscopy is the spectral lines. There are physical processes that produce light of many different energies, other processes that produce light at a single energy. The physical process that produces light at many different energies has a distinctive signature in a spectrum – we call this continuum emission. This signature is different from that of a process that produces light at a single energy – what we call line emission.
If you see a line, you can tell which element it was emitted by; by comparing many lines, you can estimate how much oxygen there is in the X-ray emitting gas, for example. You can also use lines to study the motion of gas: the Doppler effect shifts the observed energy of the line, if the gas is moving towards us or away from us. Spectra of black holes can therefore reveal orbiting disks of matter.