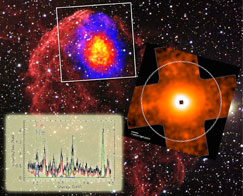
Let's look at a spectrum that an X-ray astronomer would see from a supernova remnant.
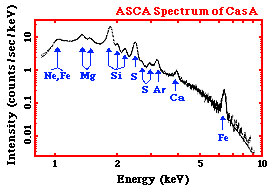
Above is an X-ray spectrum made using data from the ASCA satellite. It is of a supernova remnant (SNR), which is a huge cloud of gaseous matter swept up from the explosion of a massive star. The x-axis shows the range of energy of light that is being received by the ASCA detector from the SNR. The y-axis of the graph shows the intensity of the light recorded by the instrument from the SNR – that is, the number of photons of light the SNR is giving off at each energy, multiplied by the sensitivity of the instrument at that energy. We can tell that the light, or radiation, from this SNR is very high energy. If we look at the units of the x-axis, we can see that the photons of light have energys measured in keV, or kilo-electron Volts. A kilo-electron Volt is 1000 electron Volts (eV). This puts is the X-ray range of the electromagnetic spectrum.
The graph shows a decreasing curve, with lots of bumps in it. The curve itself is called a continuum; that is, it represents X-ray photons emitted at all energies continuously. The X-rays that are producing this continuum can be caused by several mechanism that are completely different than those producing the X-rays at the various peaks and bumps on the curve. The peaks and bumps are called line emission.
Not only are these two different kind of X-ray emission (continuum and line) produced differently, but they each tell us different things about the source that is emitting them.