
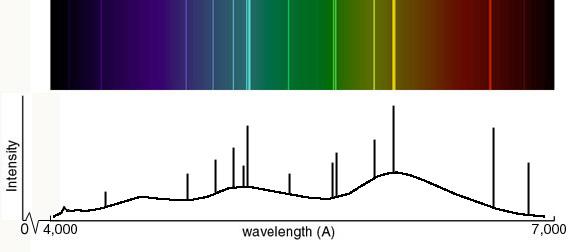
The graphical representation should include all visible lines shown in the color specrum. The continuum should rise gradually from 4000 Ångstroms, and remain fairly constant through blue, and decrease slightly in green portion of the spectrum. It should increase again, reach a maximum near yellow, and then decline again in the red.
Below are the solutions for the identifying the lines in the spectra of hydrogen and helium.
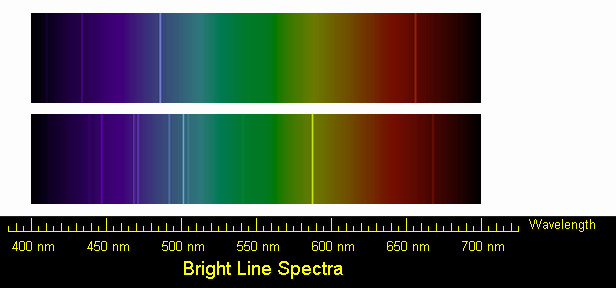
We can identify three bright lines for hydrogen in the top spectrum. Measuring from the scale, the wavelengths are 435 nm (purple), 486 nm (blue) and 657 nm (red). Recall (e.g. from the Calculation Investigation) that the the frequency is given by n = c / l, and the energy is given by E = hn (where h = 6.626 × 10⁻³⁴J-s, and c = 3 × 10⁸ m/s). In the table below we summarize the frequency and energy results for these lines. (We include the color to aid in identifying the line in the spectrum.)
| Wavelength (nm) | Color | Frequency (Hz) | Energy (J) |
| 435 | purple | 6.90 × 10¹⁴ | 4.57 × 10⁻¹⁹ |
| 486 | blue | 6.17 × 10¹⁴ | 4.09 × 10⁻¹⁹ |
| 657 | red | 4.57 × 10¹⁴ | 3.03 × 10⁻¹⁹ |
We can identify a number of lines in the spectrum of Helium. The bright lines are listed in the table below, along with their frequencies and energies. Students may identify any two of these.
| Wavelength (nm) | Color | Frequency (Hz) | Energy (J) |
| 447 | purple | 6.71 × 10¹⁴ | 4.45 × 10⁻¹⁹ |
| 469 | blue | 6.40 × 10¹⁴ | 4.24 × 10⁻¹⁹ |
| 472 | blue | 6.36 × 10¹⁴ | 4.21 × 10⁻¹⁹ |
| 493 | blue-green | 6.09 × 10¹⁴ | 4.03 × 10⁻¹⁹ |
| 501 | blue-green | 5.99 × 10¹⁴ | 3.97 × 10⁻¹⁹ |
| 505 | blue-green | 5.94 × 10¹⁴ | 3.94 × 10⁻¹⁹ |
| 587 | yellow | 5.11 x 10¹⁴ | 3.39 x 10⁻¹⁹ |
| 669 | red | 4.48 × 10¹⁴ | 2.97 × 10⁻¹⁹ |