Seeds of Modern Universe
Wilkinson Microwave Anisotropy Probe (WMAP)
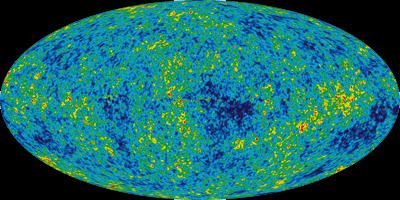
After the success of the COBE mission, as discussed in the 1993 edition of Cosmic Times, cosmologists wanted to follow-up with a mission that could map the cosmic microwave background (CMB) in greater detail. The result was the Wilkinson Microwave Anisotropy Probe (WMAP). The first WMAP map of the CMB was released in February 2003. A more refined map released in March 2006, which is the one highlighted in this edition of Cosmic Times. As of August 2008, WMAP continues to scan the sky, creating a more-and-more detailed map of the CMB.
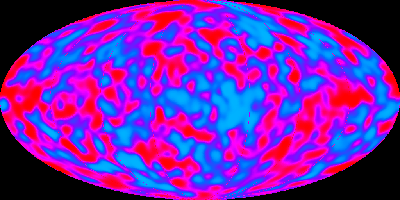
The images below show the maps from COBE and WMAP to illustrate the increased detail in the WMAP data.
COBE image:

WMAP image:

COBE (top) and WMAP (bottom) maps of the cosmic microwave background.
Top: The map from COBE. (Image credits: NASA/COBE and NASA/WMAP)
Flat Universe
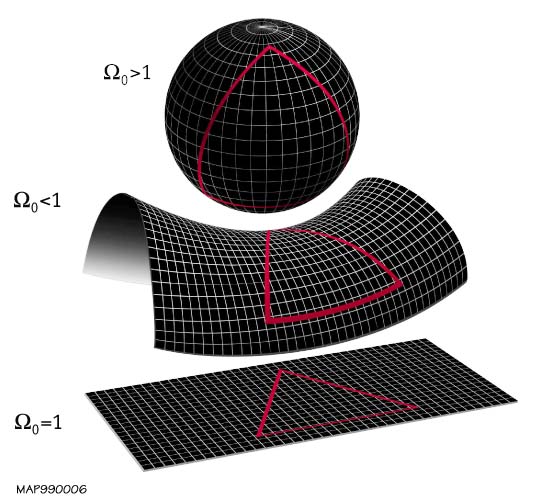
In the early 1990s, one un-answered question in cosmology was what the ultimate geometry of the Universe was. There were three possibilities envisioned: positively curved like the surface of a sphere, negatively curved like a saddle, or flat like a geometric plane. It is difficult to envision these geometries for our 4-dimensional spacetime, but the image below shows what they look like for 2-dimensionals.

Three possible geometries. The top shows a spherical geometry, which is characterized by a positive curvature and is finite in extent. The middle image shows a hyperbolic paraboloid, or a saddle-like, geometry, which is characterized by a negative curvature and is infinite in extent. The bottom geometry is a plane, or flat, geometry, which is characterized by no curvature and is infinite in extent. (Image credit: NASA/WMAP)
Measurements at the beginning of this decade by balloon-borne instruments such as BOOMERANG and MAXIMA demonstrated that the geometry of the Universe is flat. WMAP confirmed these measurements. However, WMAP was able to go further. With the geometry of the Universe pinned down, WMAP was able to determine the relative abundances of the different components of the Universe. WMAP found that normal matter comprises 4%, of the Universe, dark matter at 23%, and dark energy at 73%.
Refined Picture of the Early Universe
After reading this article, one question that might linger is how are the CMB and inflation related? Indeed, the article discusses how the current map of the CMB can tell us about the period of inflation, but the two events – inflation and the emission of the CMB – occurred at different times in the history of the Universe.
The CMB was emitted about 400,000 years after the Big Bang, which is relatively close to the Big Bang, considering the 13 billion year age estimate of the Universe. However, inflation occurred within a few seconds of the Big Bang, so it might be hard to see how the CMB could tell us much about inflation.
When we discussed inflation in the 1993 edition of Cosmic Times, we said that it explained some of the problems with Big Bang theory, including the "smoothness" of the CMB. As it turns out, inflation also explains another problem of Big Bang theory – how structure in the Universe formed. Structure came about because of some quantum physics effects, namely the Heisenberg Uncertainty Principle. Because of this, not all regions of spacetime experienced the exact same amount of inflation. Tiny regions that experienced a little less inflation had higher densities than those that experienced a little more inflation. The higher-density regions represent places where gravity took hold and started the process of structure formation.
The WMAP picture of the early Universe can resolve some of these structures, allowing cosmologists to begin to associate density fluctuations in the early Universe with grand-scale structures that we see today.
Other resources
The following webpages have more detailed information:
- WMAP Website – there are teaching materials, animations and further information about cosmology which may be useful
- Timeline of the Universe Image
- BOOMERANG
- MAXIMA


