Spectral Analysis
Spectral Analysis
In a star, there are many elements present. We can tell which ones are there by looking at the spectrum of the star. The science of spectroscopy is quite sophisticated. From spectral lines astronomers can determine not only the element, but the temperature and density of that element in the star. The lines can also tell us about the magnetic field of the star. The width of the line can tell us how fast the material is moving, giving us information about stellar wind. If the lines shift back and forth, it means that the star may be orbiting another star - the spectrum will give the information necessary to estimating the mass and size of the star system and the companion star. If the lines grow and fade in strength we can learn about the physical changes in the star.
Spectral information, particularly from energies of light other than optical, can tell us about material around stars. This material may have been pulled from a companion star by a black hole or a neutron star, where it will form an orbiting disk. Around a compact object (black hole, neutron star), the material in this accretion disk is heated to the point that it gives off X-rays, and the material eventually falls onto the black hole or neutron star. It is by looking at the spectrum of X-rays being emitted by that object and its surrounding disk that we can learn about the nature of these objects.
As discussed in the introduction to spectra, a spectrum is simply a chart or graph of the intensity of light of a source as a function of the energy of that light. Each spectrum holds a wide variety of information. For instance, there are many different mechanisms by which an object, like a star, can produce light. Each of these mechanisms has a characteristic spectrum.
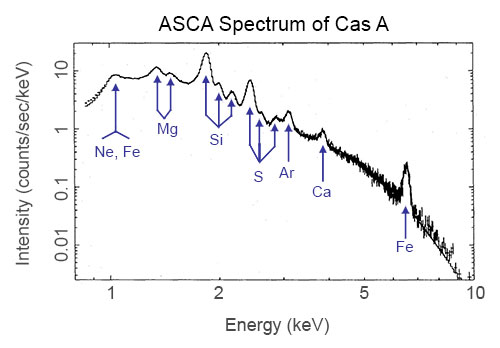
Look at the sample spectrum below.

X-ray spectrum of supernova remnant Cas A from ASCA data. (Credit: Holt et al., PASJ 1994)
This spectrum was taken by the ASCA satellite. It is an X-ray spectrum of a supernova remnant (SNR), which is a huge cloud of gaseous matter swept up from the explosion of a massive star. The x-axis shows the range of energy of light that is being emitted (the units are keV, or kilo-electron Volts, which are the common units astronomers use to talk about X-ray light). The y-axis of the graph shows the intensity of the light being emitted by the SNR — that is, how many photons of light the SNR is giving off at each energy.
There are two main types of spectra in this graph – a continuum and emission lines. Notice that the overall curve decreases with higher energies. This decreasing curve is called a continuum, and is produced by a process that emits photons at all energies. That curve, though, has bumps on it, which are marked by the symbols for various elements like neon (Ne), calcium (Ca), and iron (Fe). These bumps are called line emission and occur at very specific energies. These two different types of X-ray emission (continuum and line) are produced by different processes and each tells us different things about the source emitting them.
Below we'll go into more detail about line and continuum emission, such as what mechanisms cause them, and what they can tell us about the light-emitting object. However, you might first want to understand a little more about atoms and about how spectra are represented graphically. Use the links below to read more about those topics.
![]() Tell Me More About Understanding the Atom!
Tell Me More About Understanding the Atom!
![]() Tell Me More About Graphical Representations of Spectra!
Tell Me More About Graphical Representations of Spectra!
Line Emission
Remember that if we use a spectrometer on white light (like an ordinary light bulb), we'll see a rainbow. However, what if instead we used our spectrometer to look at a tube of pure gas, like hydrogen? First, we need to heat the hydrogen to a very high temperature, or give the atoms of hydrogen energy by running an electric current through the tube. This would cause the gas to glow, or in other words, to emit radiation.

A hydrogen emission lamp. (Credit: Photo by Wilco Oelen via Wikimedia Commons
The spectrum of hydrogen. The bright lights are emission lines, and the pattern is unique to hydrogen. Other elements show different patterns of emission lines, making this spectrum a "fingerprint" of the element hydrogen.
The bright lines are called emission lines. Remember how we heated the hydrogen to give the atoms energy? By doing that, we excited the electrons in the atom. When the electrons fell back to their ground state, they gave off photons of light at hydrogen's characteristic energies. If we altered the amount or abundance of hydrogen gas we have, we could change the intensity and brightness of the lines, because more photons would be produced. But we couldn't change their color, because no matter how much or how little hydrogen gas was present, the pattern of lines would be the same. Hydrogen's pattern of emission lines is unique to it. The brightness of the emission lines can give us a great deal of information about the abundance of hydrogen present. This is particularly useful in a star, where there are many elements mixed together.
Each element in the periodic table can appear in gaseous form and will each produce a series of bright emission lines unique to that element. The spectrum of hydrogen will not look like the spectrum of helium, or the spectrum of carbon, or of any other element.
Helium
Carbon
We know that the continuum of the electromagnetic spectrum extends from low-energy radio waves, to microwaves, to infrared, to optical light, to ultraviolet, to X-rays and gamma rays. In the same way, hydrogen's unique spectrum extends over a range, as do the spectra of the other elements. The above spectra are in the optical range of light. Line emission can actually occur at any energy of light (i.e. visible, UV, etc. ) and with any type of atom. However, not all atoms have line emission at all wavelengths. The difference in energy between levels in the atom is not great enough for the emission to be X-rays in atoms of lighter elements, for example.
Continuum Emission
We'll focus this discussion of continuum emission on those processes that produce X-rays. Just like visible light, with its range of energies from red to blue, X-rays have a continuum, or a range of energies associated with it. X-rays usually range in energy from around 0.5 keV up to around 1000 keV.
Like line emission, continuum X-ray emission involves charged particles. Continuum emission is a result of the acceleration of a population of charged particles. All X-ray sources contain such particles. These particles must be at least partially ionized, which means their electrons need to be unbound from their nuclei to be free to zip around when they are heated to extreme temperatures. For an electron to radiate X-rays, the gas containing the electron must have extreme conditions, such as temperatures of millions of degrees, super-strong magnetic fields, or the electrons themselves must be moving at nearly the speed of light. Extreme conditions can be found in disks of matter orbiting black holes or in supernova remnants. Strong magnetic fields, like those created in the wake of a supernova explosion, can also accelerate fast-moving ions in spirals around the field lines to the point of X-ray emission. Electrons can be accelerated to nearly the speed of light in the shockwave created by a supernova explosion.
There are three mechanisms that will produce continuum X-ray emission. They are Synchrotron Radiation, Bremsstrahlung, and Compton Scattering. Because the populations of electrons have a continuous range of energies, and they can be accelerated through a range of energies, the radiation produced is continuous, and not at the discreet energies of line emission.

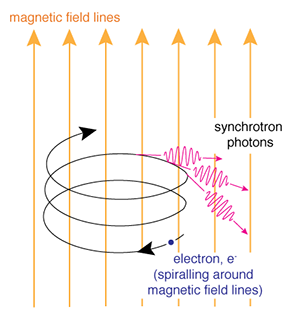
Illustration of the process of synchrotron radiation. (Credit: NASA's Imagine the Universe)
Synchrotron radiation is emitted when a fast electron interacts with a magnetic field. A magnetic field in an area where an electron is traveling will cause the electron to change direction by exerting a force on it perpendicular to the direction the electron is moving. As a result, the electron will be accelerated, causing it to radiate electromagnetic energy. This is called magnetic bremsstrahlung or synchrotron radiation (after radiation observed from particle accelerators by that name). If the electrons and the magnetic field are energetic enough, the emitted radiation can be in the form of X-rays.
Gas that is at about 1 million to 10 million degrees, such as the gas heated by a supernova explosion, produces most of its emission in X-rays from thermal bremsstrahlung. Gas can be heated to these temperatures by the resulting shockwave of a supernova explosion, or in an accretion disk around a black hole or neutron star.

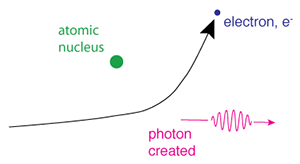
Illustration of the process of Bremsstralung radiation. (Credit: NASA's Imagine the Universe)
Bremsstrahlung occurs when an electron passes close to a positive ion, and the strong electric forces cause its trajectory to change. The acceleration of the electron in this way causes it to radiate electromagnetic energy. This radiation is called bremsstrahlung, which in German translates literally to "braking radiation." Thermal bremsstrahlung occurs in a hot gas, where many electrons are stripped from their nuclei, leaving a population of electrons and positive ions. If the gas is hot enough (millions of degrees Celsius), this kind of radiation will primarily take the form of X-rays.
Supernova remnants (SNRs) have strong magnetic fields where ions can be accelerated by the shock wave of the supernova to high energies, producing X-ray synchrotron radiation. X-rays produced by SNR require electrons with energies of about 104 GeV each. We would have to heat an electron to a temperature of about ten trillion degrees for it to have this much energy!
Credit:NASA
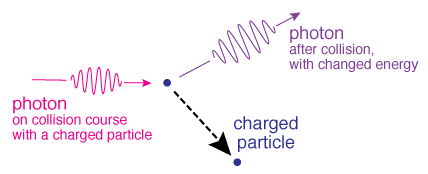
Comptonization is when a photon collides with an electron - the photon will either give up energy to or gain energy from the electron, changing the electron's velocity as a result.
Compton scattered radiation and synchrotron radiation are major components of the diffuse X-ray background and emission from active galaxies.

Illustration of the process of Compton radiation. (Credit: NASA's Imagine the Universe)
Credit:NASA
![]() Use Hera to analyze spectra.
Use Hera to analyze spectra.
Updated: August 2013

